The Risk Graph is a vital tool in establishing an options position whether you are simply buying calls and puts or placing more advanced spread based options trades. A trader who buys equity positions outright can quickly calculate profits and losses solely based on price. For example, if you purchase IBM at 185.00 per share and sell it at 190.00 your profit is 5.00 whether you sell it today or two weeks from now. However since options prices take into account a number of factors such as volatility and time and those both effect the options price there is no basic way to calculate potential reward and risk on the position.
Options prices are based on the Black-Scholes method which takes into account the current stock price, the intrinsic value, time to expiration, volatility, and interest rates to establish a premium price. Because these values constantly change the values of an option price are constantly changing which can present a challenge to the trader to forecast potential reward-risk on their trades. The Profit Loss tool is a essentially a calculator which takes into account options pricing models to return to the trader the potential gain or loss an option will incur based on market movement and days until the options expires.
Risk Graph Window
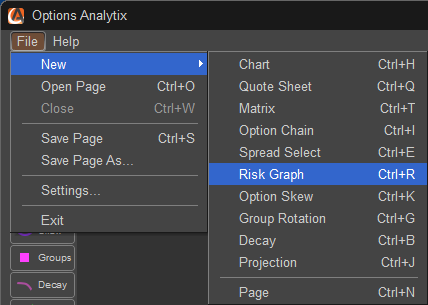
The Risk Graph Window can be opened in multiple ways. The first methods is to move your mouse over the SKEW button and press the left mouse button or click on FILE, select NEW, and choose Risk Graph; you can also press CTRL-R on your keyboard.
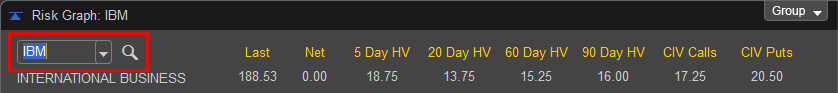
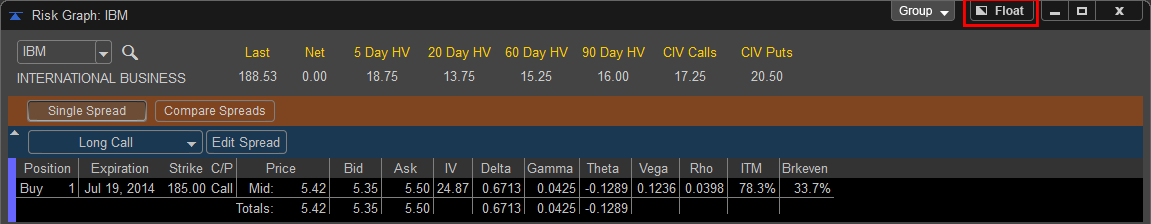
The Risk Graph window will load the symbol specified as the default in the Settings menu, which is IBM. To change the symbol left click in the Symbol window in the upper left hand corner of the Risk Graph Window. If you do not know the symbol there is a symbol lookup function which can be accessed by left clicking on the magnifying glass located to the right of the symbol field. Once the symbol is entered press ENTER or on your keyboard to load the new Symbol into the Risk Graph. The company name will be displayed below the symbol field, in addition to the right of the symbol window you will be given the last price of the stock which is updated in real time as well as the values of 20, 45, 60, and 90 Day Historical Volatility and the Continuous Implied Volatility of both Calls and Puts.
The FLOAT/DOCK feature allows the window to be removed from the application and moved to a secondary monitor or another part of the desktop. This can be done by left clicking on the FLOAT button and moving the window manually. Once this window is in FLOAT mode the button will be relabeled as DOCK and can be pressed to return the Risk Graph window back into the main application window.
![]()
![]()
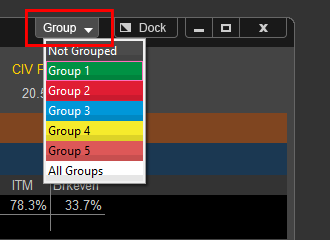
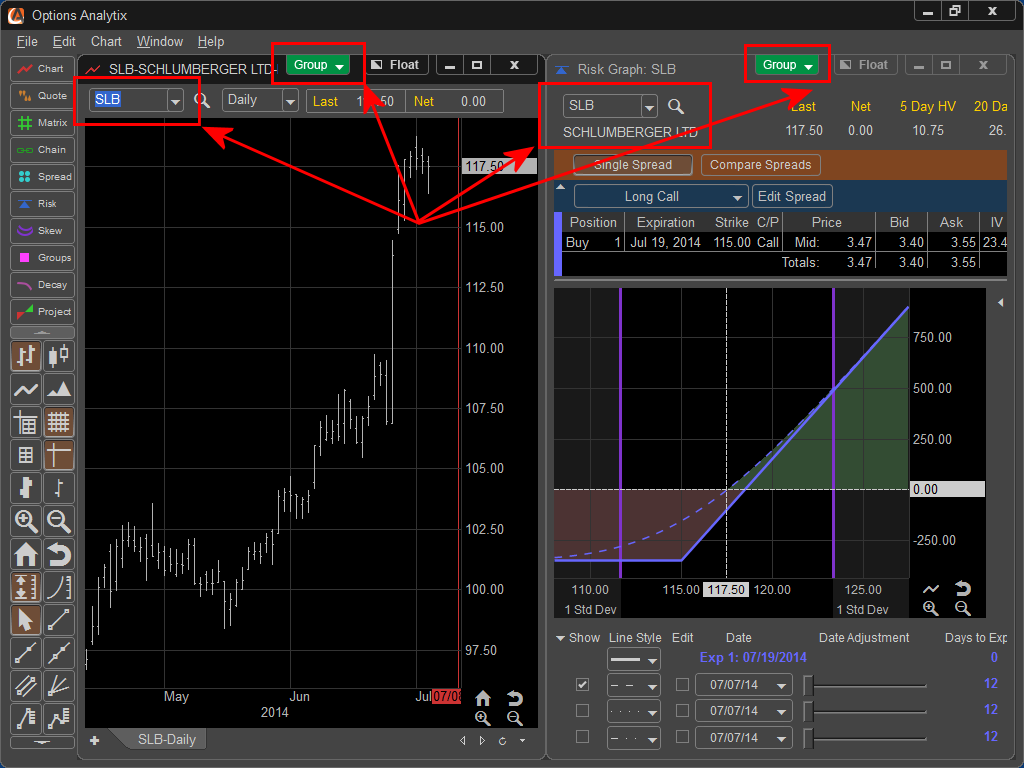
The Risk Graph window can be linked with other windows within the application by left clicking on the Group button in the upper right hand corner of the window. This allows the Risk Graph to sync with other windows within the application, for example if a symbol is changed on a chart the Spread Select will adjust to the same symbol if those windows are linked together.
Risk Graph Operation
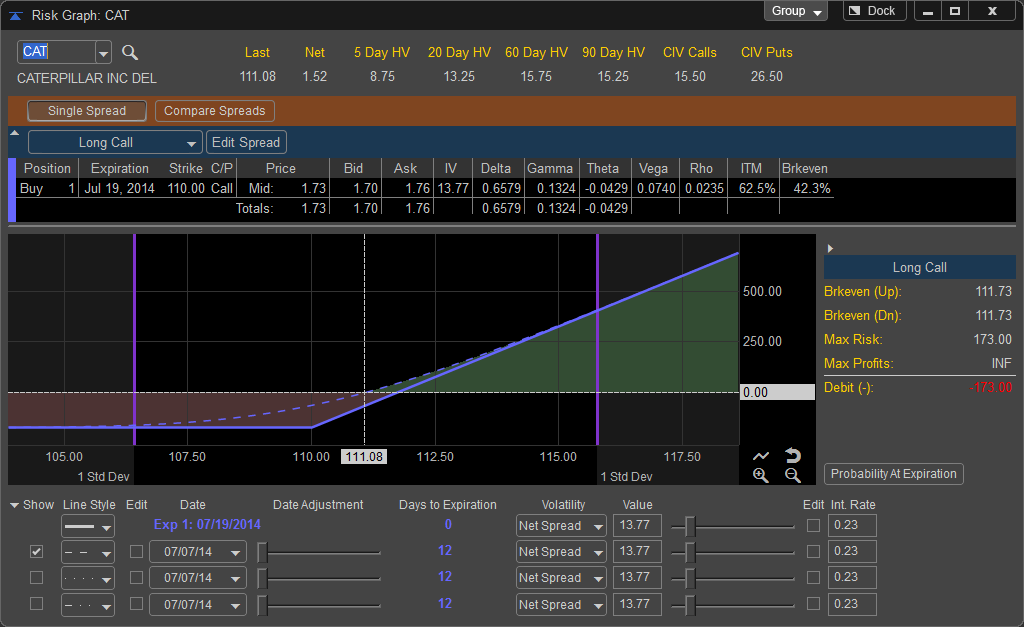
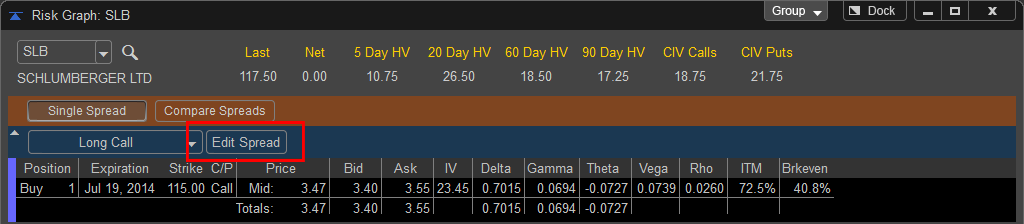
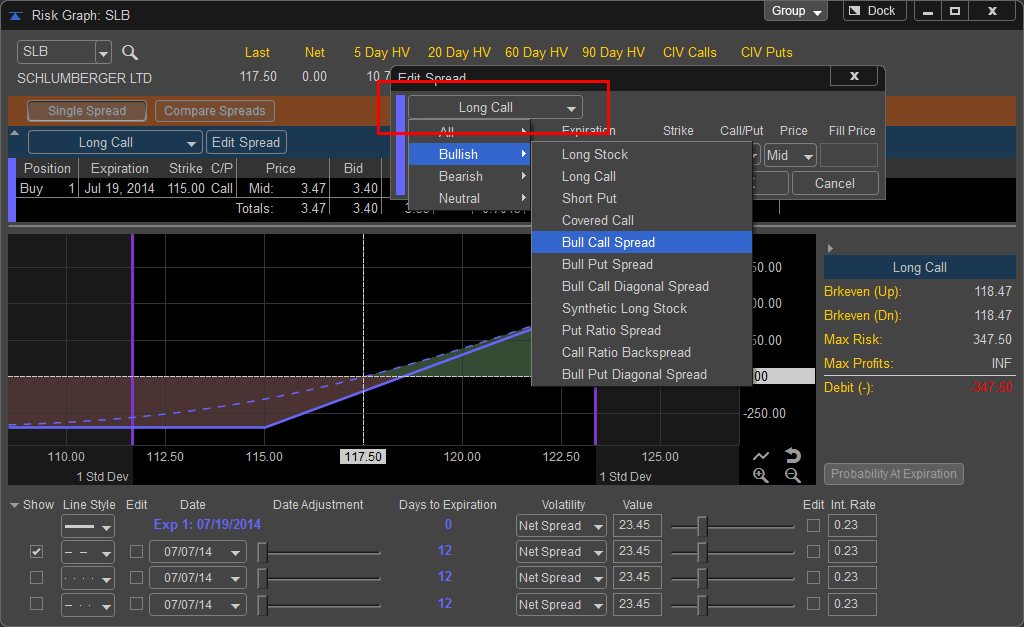
The Risk Graph will default to a Long Call Trade based on an At the Money Call at next monthly expiration. If you wish to edit the pre-selected option contract chosen you can do this by clicking the Edit Spread button in the Option Selection area of the Risk Graph
.
When the Edit Spread dialog appears you can choose from over 30 prebuilt option spreads sorted by market sentiment by left clicking on the spread template drop down menu.
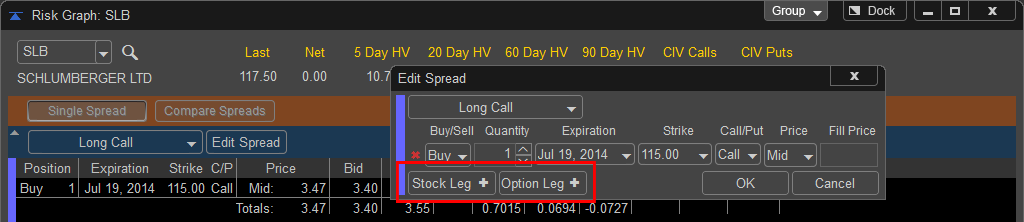
You can also choose to build your own spread by manually choosing up to eight option legs and one stock leg. To add a stock leg to your spread left click on the "Stock Leg +" button, to add an option leg, left click on the "Option Leg +" button.
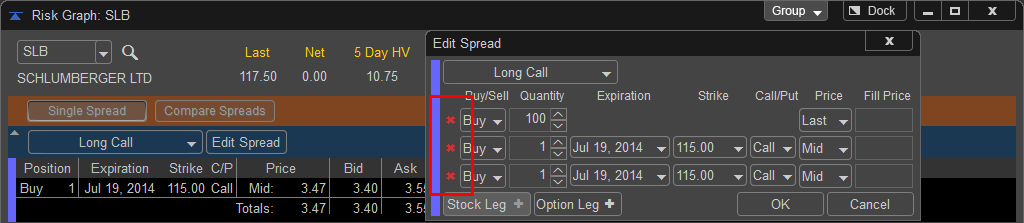
To remove unneeded Stock or Option Legs left click on the Red X to the left of the leg you wish to delete.
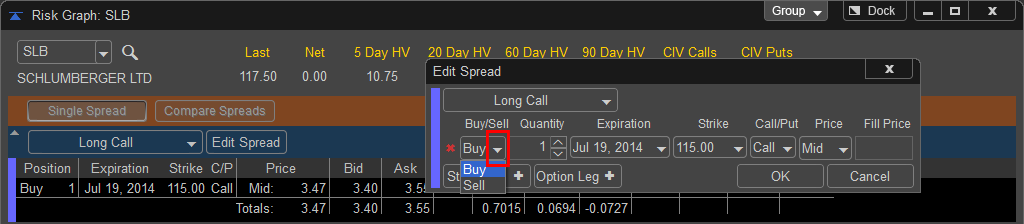
The position direction can be adjusted by left clicking on the Buy or Sell drop down menu and choosing the desired side. In this case since we are using the default prebuilt template the position sides are automatically chosen.
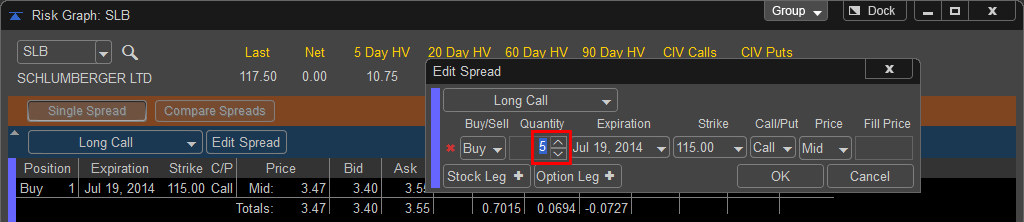
In addition the trade size can be adjusted by manually entering in a new quantity or left clicking on the up and down arrows to the left of the quantity field.
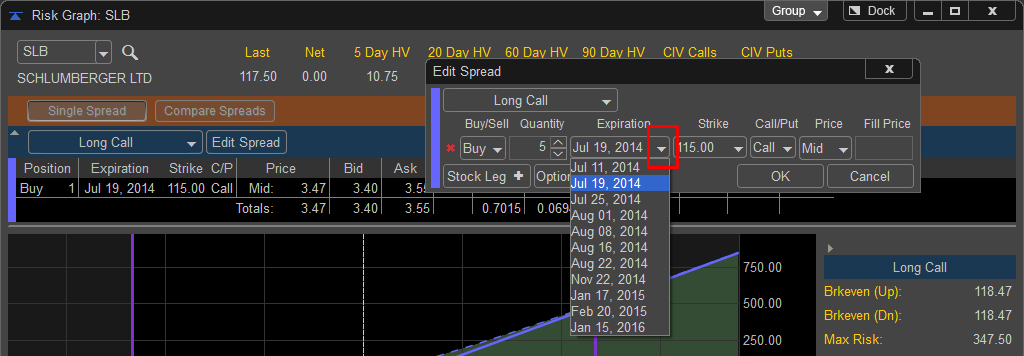
If the trader wishes to choose a different expiration month the drop down menu will display all available option expirations. By changing the first expiration in a multi leg spread the software will automatically adjust all legs to the new expiration.
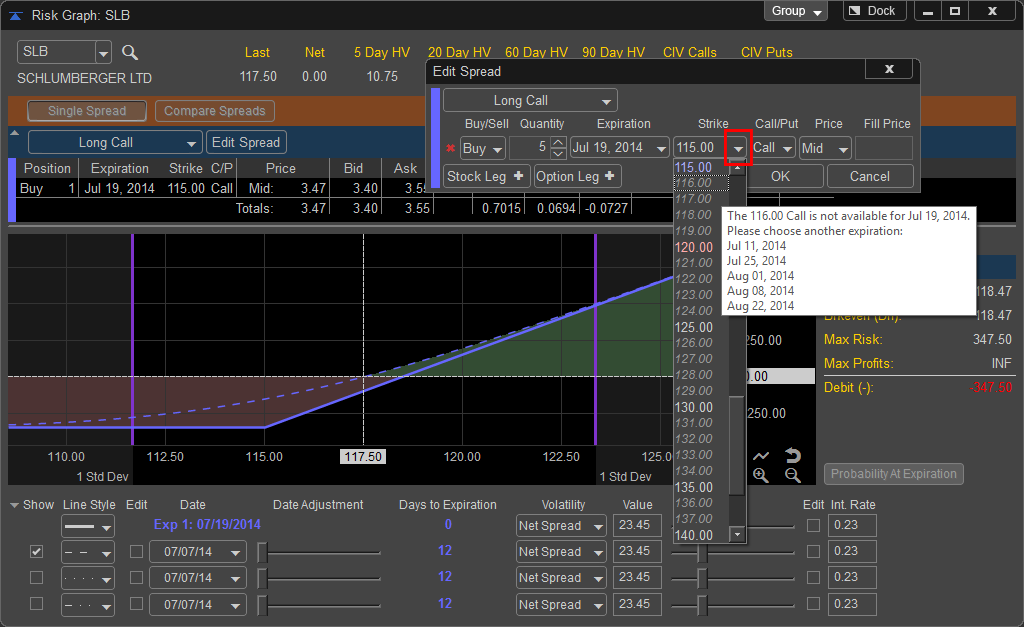
To change the default strike price the user can left click on the drop down menus under the Strike column. Available strikes for the chosen expiration are showed in bold type. Strikes that are unavailable for the chosen expiration are greyed out. When a strike price that is not available for the chosen expiration is chosen the software will display a message alerting the user which expirations are available for the chosen strike price.
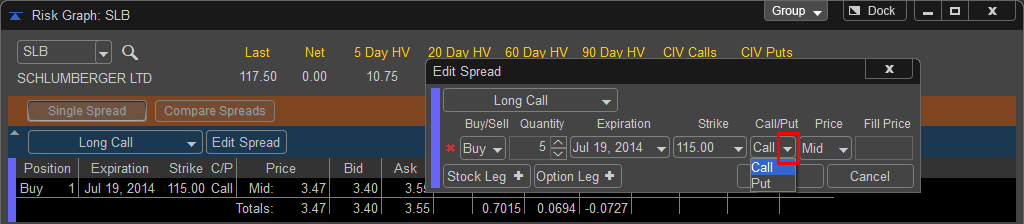
When using a pre-built template the software automatically selects which legs of the trade should be calls or puts. If the trader builds a spread manually or prefers to adjust the prebuilt spread to another spread type the C/P column allows the changing of the legs to Calls or Puts.
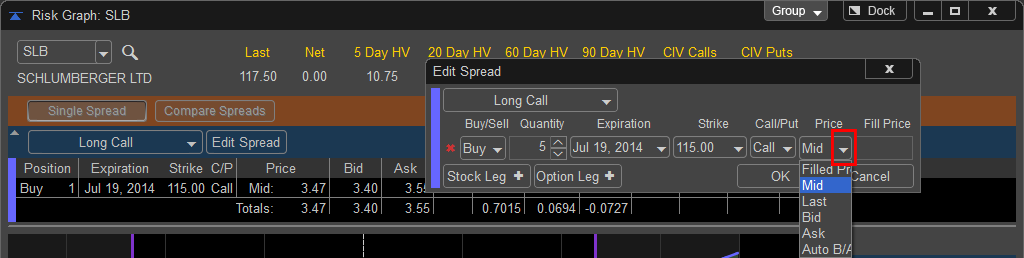
The Projection tool chooses the midpoint between the bid and ask for the default price to calculate the position changes from. In addition, the trader can choose to build the trade either on the Bid, Ask,
Last, Auto B/A, r a custom price which is identified by choosing Filled.
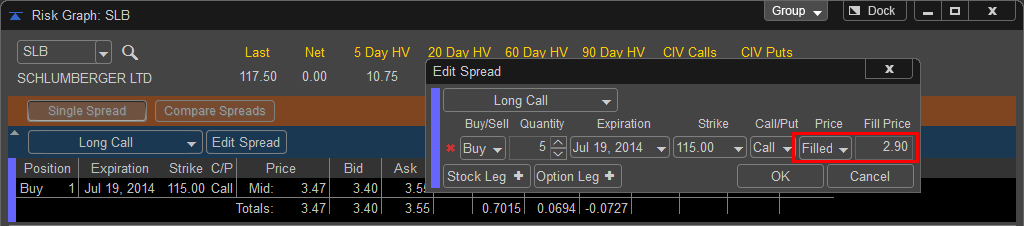
The user can also manually enter in a price based on a position they already own by typing in a price in the Price column, once a new price is entered the projection tool will change the drop down to Filled to simulate the price the trader bought or sold the underlying position at.
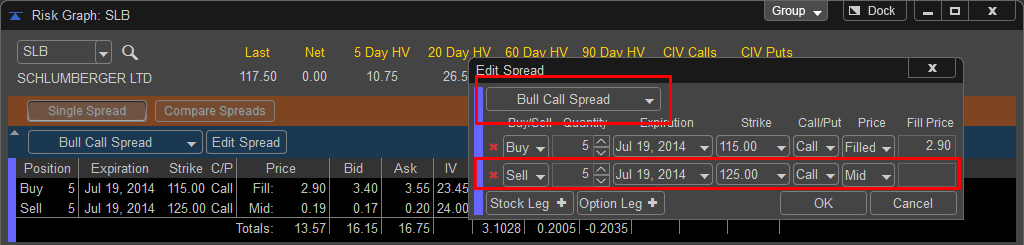
If an added option leg results in the spread matching one of the prebuilt spread templates the Risk Graph show the spread name in the Spread Template dropdown menu. By adding an additional Call leg this example has been made into a Bull Call Spread.
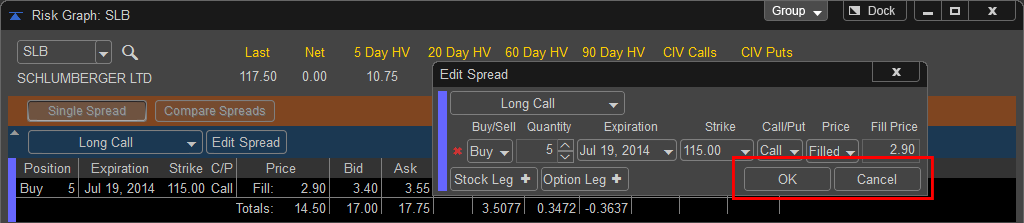
Once any changes to the legs are made the user selects OK to apply the changes or Cancel to erase them.
Once the Option position is selected the Risk Graph displays the current Spread Costs and Net Values for Delta and Gamma. In addition a spread summary window will display spread costs, max profit and loss, and breakeven up and down levels for the chosen spread.
Bid - The price at which an investor can sell to a broker-dealer.
Ask - The lowest price anyone is willing to sell a specific contract at a given moment in time also called the offer.
IV - Implied volatility measures whether option premiums are relatively expensive or inexpensive. Implied volatility is calculated based on the currently traded option premiums. A mathematical formula, using stock price, strike price, time to maturity, interest rate and historical volatility, is used to arrive at the implied volatility number. An IV of 20 (20%) on a $100 stock implies that over the course of the next year the stock is expected to make a one standard deviation move of $20 (20% of $100). This means that within one calendar year there is a 68% probability (one standard deviation) that the stock will be priced between $80 and $120 per share.
Delta - Delta measures how much an option price will move relative to the underlying asset. It is the percentage change in the option premium for each dollar change in the underlying option. For example, a call option with a delta of 0.8 means for every $1 the stock increases the call option will increase by 80 cents. The Delta of a put is represented by negative numbers, a Delta of -.50 on a put indicates a decrease of $1 dollar on the underlying stock will result in an increase of 50 cents on the option.
Gamma - The rate of change for delta as it relates to the stock price. If the Gamma is .10 and the stock moves $1 per share the Delta of the option will either increase (stock moving up) or decrease (stock moving lower) by .10.
Vega - Vega is the sensitivity of the option price to changes in implied volatility. Vega measures the change in the option premium due to changes in the volatility of the underlying stock, and is always expressed as a positive number. A Vega of .20 indicates that the option price will move 20 cents for every 1% change in implied volatility regardless of how the underlying stock performs. Theta - Theta measures the time decay in an option, or the amount of money an option will lose each day due to the time passing. Theta is the expected change in option price due to the passage of time. Theta is expressed as the loss of time value per day. Thus, a theta of -.1 indicates that the option is losing $.10 per day.
Rho - Typically higher interest rates will result in a higher Call premium and lower Put Premiums. Rho is the amount of change in premiums due to a 1% change in the prevailing risk-free interest rate.
ITM – The percentage chance the option has of being in the money at expiration.
Brkeven - The percentage chance the option has of at the break even price at expiration.
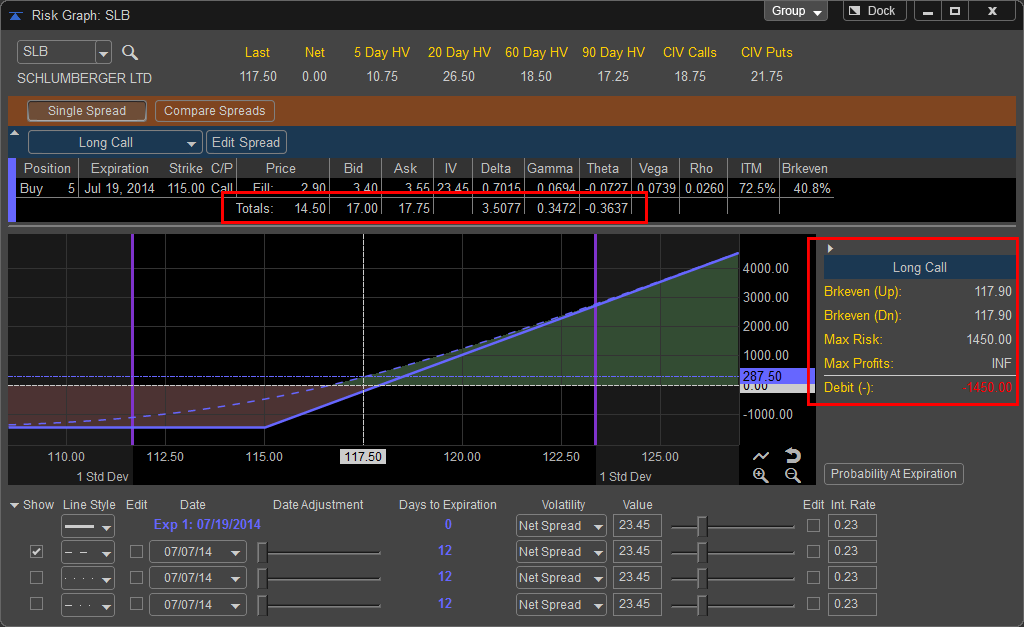
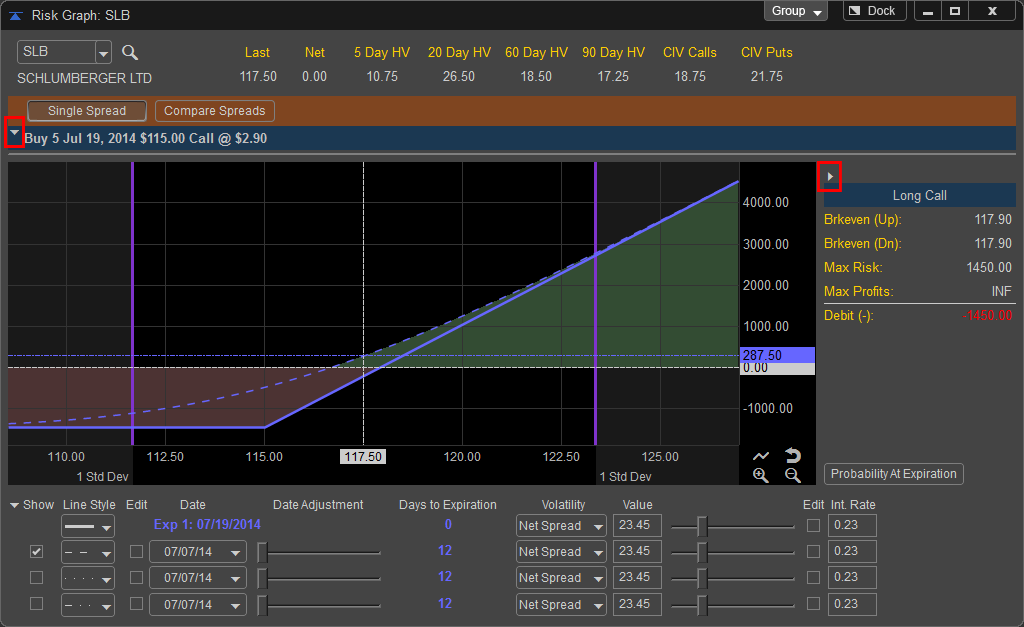
To conserve space you can collapse both the Position Entry Pane and the Spread Summary Pane by left clicking on the arrows to shrink the respective areas.
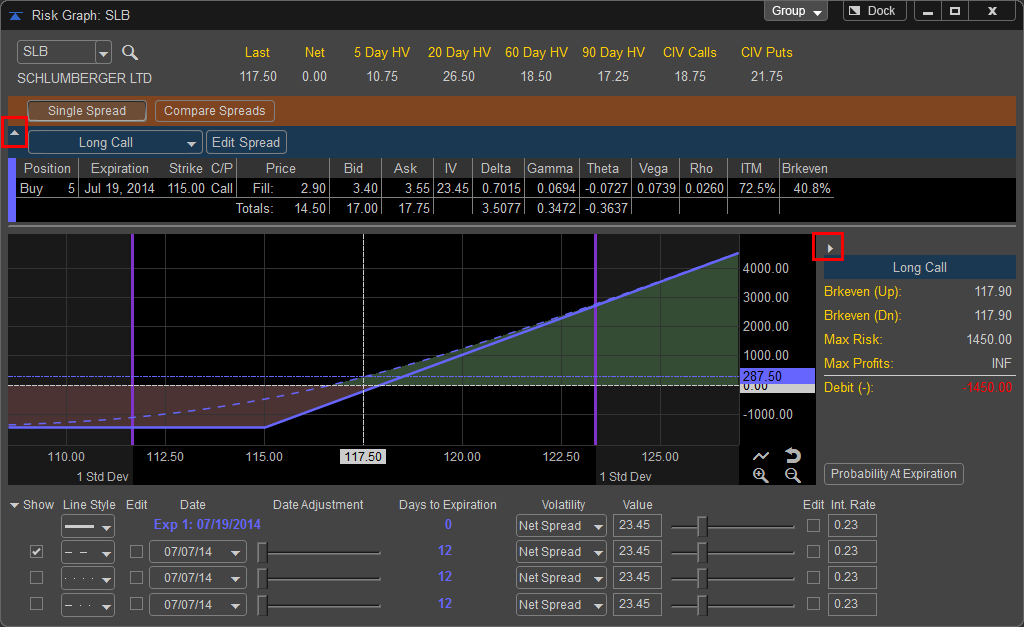
To restore the panes simply click on the arrows again.
The following spreads are available in the Spread Template Menu: