
To load a chart click on the Chart button or File - New - Chart.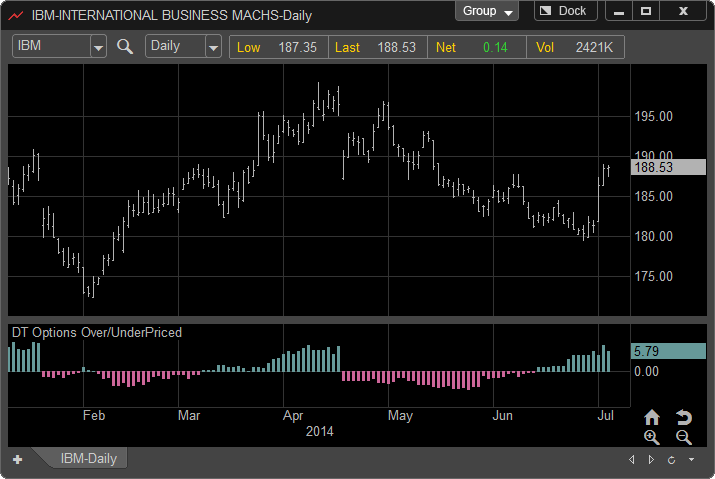
A Chart is where one can view securities in Bar, Candle Stick, Line or Area form. To learn more about each type of chart style, please click on one of the styles previously mentioned.
Changing Symbols and Time Frames
To change symbols, click in the symbol box or make sure that the chart window is the active window, type the symbol that you would like to change, and either click on the "Load" button or the Enter key on your keyboard.
To change the time frame, either click in the time box or make sure that the chart window is the active window and type the appropriate time increment. For example, if you would like to switch to a 60 minute chart, make sure that the chart window is the active window, type 60, and hit the Enter key on your keyboard. To change to a Daily, Weekly, or Monthly chart, press the comma key (",") on your keyboard and enter "D" for Daily, "W" for Weekly, or "M" for Monthly.
![]() Using this option on the chart, enables the chart to be taken out of the main program window. It then can be moved and re-sized anywhere on the screen. When the Page is saved, the window(s) that are outside of the main program will be saved in those locations as well.
Using this option on the chart, enables the chart to be taken out of the main program window. It then can be moved and re-sized anywhere on the screen. When the Page is saved, the window(s) that are outside of the main program will be saved in those locations as well.
![]() This is what will be shown when a window is currently being floated outside of the main program window. To float the window outside of the main window, click on the "Dock" button.
This is what will be shown when a window is currently being floated outside of the main program window. To float the window outside of the main window, click on the "Dock" button.
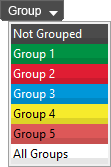
Clicking this option will drop down the color link window and link the current window with any other window that is using the same colored link.
Drag and Drop: The Quote Sheet offers the ability to drag and drop symbols from the Quote Sheet to a chart. To drag a symbol from the Quote Sheet to any chart, click with the left mouse button and hold it down while moving your cursor to the chart. When the cursor is at the chart, release the left mouse button.
Chart Drawing Tools: Trend Line, Ray, Extended Line, Linear Regression, Speed and Resistance Line, Fibonacci Retracement, Fibonacci Extension, Profit Line and Text.
Context Menu
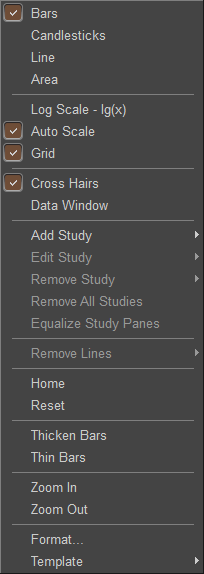
Below is the menu that will appear when you right click on a chart or left click "Chart" from the menu. At this point, you can modify the way the chart looks by adding, editing, or removing studies or lines or by restoring your chart to the original specifications.
When "Add Study" is selected, it will expand and show the available Studies as shown below. To learn more about a specific feature in the context menu, click on the image below or scroll down for other options.
Context Menu Chart Features:
Bar Chart - Displays chart data in Open High Low Close bar format.
Candlesticks - Displays chart data using the Candlestick format.
Line - Displays chart data in a single Close Line format.
Area - Displays chart in an Area (mountain) format.
Log Scale - lg(X) - This check box turns on/off the display of the chart data using a Log Scale. The default is normal.
Grid - This feature turns the grid lines on the chart on or off.
Cross Hairs - The cross hairs will display the date and price on the X-axis and Y-axis for the chart.
Data Window - Displays a movable window in the upper left corner of the chart displaying that chart and study data based on the mouse location on the chart.
Add Study: To add a study to any chart, right click on the chart and select "Add Study."
Edit Study - Choose "Edit Study" to edit any of the studies that are active on the chart. This will only be active if a study is active on the chart.
Remove Study - Choose "Remove Study" to remove a study one at a time that are active on the chart. This will only be active if a study is active on the chart.
Remove All Studies - Choose "Remove All Studies to remove all studies from the chart.
Equalize Study Panes - This feature re-sizes all studies loaded at the bottom of the chart to be the same height making them equal.
For Current Symbol - This will remove all lines for the current symbol.
For All Symbols - This will remove all lines from any symbol that has been loaded in the selected chart window.
Home - Chart Home will place the chart to the right side of the screen in order to see the last bar.
Reset - Resetting the chart will change the chart back to the original scaling, the original thickness of bars and to the original offset.
Template
Load... - This will open a new window where one can select a saved template.
Save... - This will open a new window where one can save a new template.
Set As Default - Clicking this option will set the current appearance as the new default template.
Load Factory Default - Clicking this option will remove any loaded template and restore it to the factory default settings.