Average Directional Movement (ADX - DMI)
 In New Concepts in Technical Trading Systems, written in 1978 by J. Welles Wilder, Jr., Directional Movement is compared to chasing the end of a rainbow: the closer one gets to it, the more elusive it becomes. The strength of the Directional Movement system identifies whether the market is trending before providing signals for trading the trend.
The primary purpose of the Average Directional Movement Index (ADX) is to determine whether a market is trending or range trading. When a new potential trend is identified, we combine the ADX with the Directional Movement Index (DMI) in an attempt to generate buy and sell setups to catch the trend. The higher the DMI becomes, the greater the chance for a potential trend.
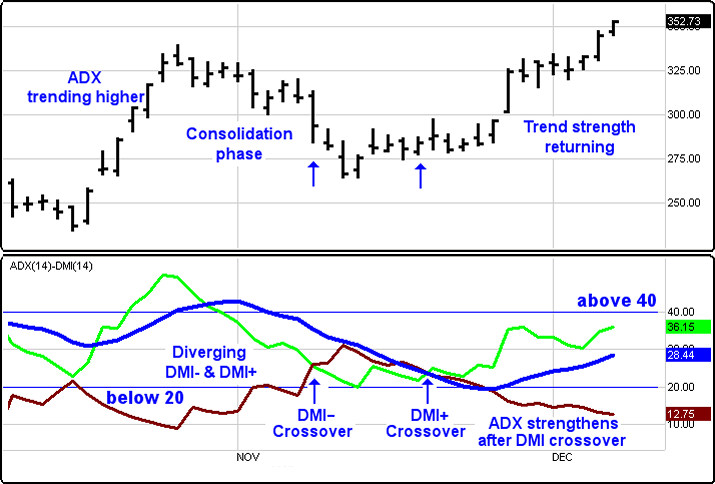
Wilder suggests using the ADX with the DMI as a filtering technique. When a DMI crossover occurs, we can focus on the ADX line to provide insights for filtering out false signals. The rising ADX line suggests that the market is better for a trend-following system. A falling ADX line suggests a non-trending system or a market losing direction.
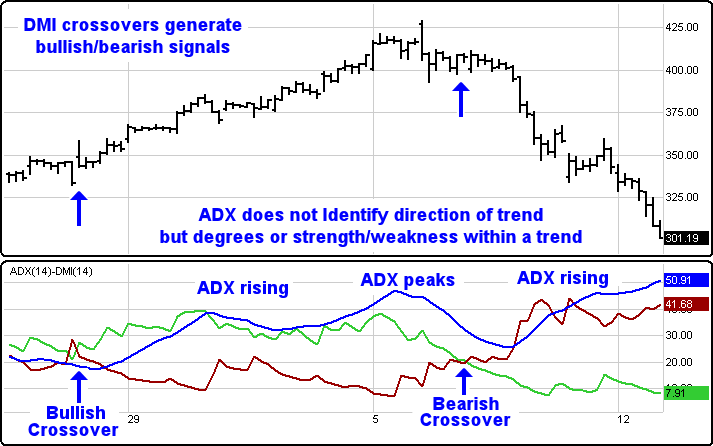
The ADX-DMI measures the ability of bulls and bears to move prices outside the previous day's trading range. The ADX-DMI consists of three lines: ADX, DMI+, and DMI-. The DMI+ gives an average of the upward trend movement. The DMI- gives an average of the downward trend movement. The ADX identifies the degree of strength or weakness within a trending market.
A DMI crossover generates the bullish and bearish signals. When the DMI+ crosses above the DMI-, a bullish signal is identified. When the DMI- crosses below the DMI+ a bearish signal is identified. Remember, the ADX line does not identify the direction of a trend; it only identifies the degree of strength or weakness within a trending market.
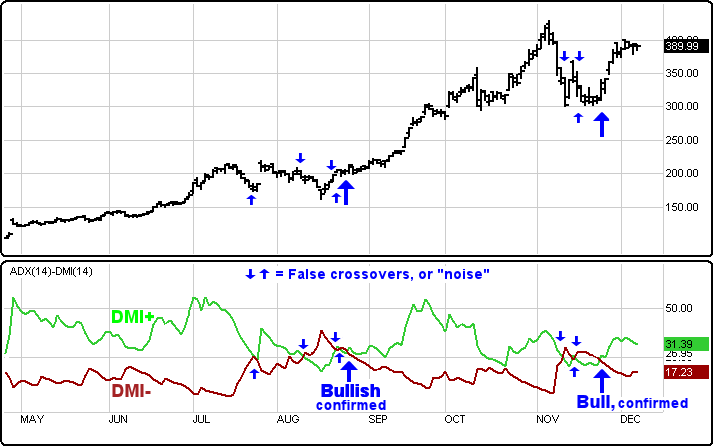
False signals is one of the weaknesses of DMI crossovers. It is one of the reasons why we use the ADX in combination with DMI.
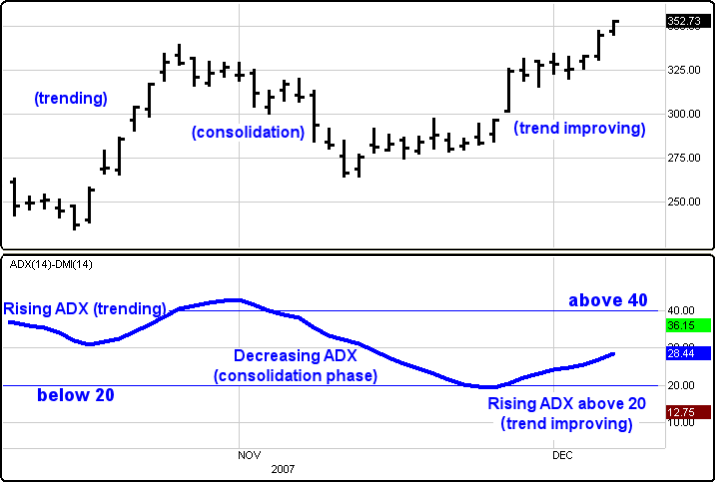
The ADX-DMI is measured using a scale 0 to 100. An ADX rising above 20 identifies better trending improvement. Moves below 20 indicate a weakening trend.
The ADX-DMI is a good indicator on its own merit, but combining it with other indicators such as momentum, volume and/or volatility,may enhance its effectiveness.
Menu:
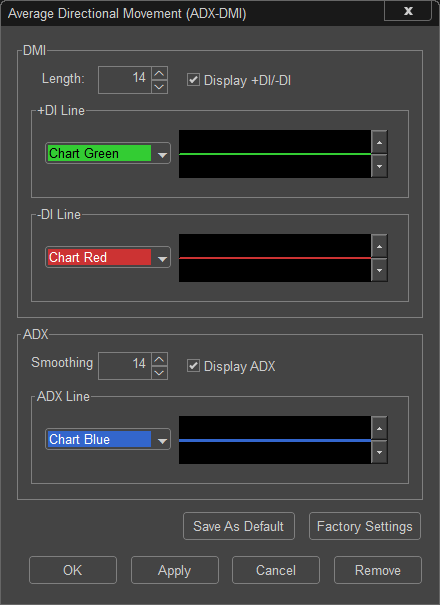
DMI
The Default Length is 14 (trading days) and can be changed by clicking in the respective box and changing the value.
If the Display +DI/-DI Checkbox is unselected then these values will be removed from the study.
+DI Line
The Color selection allows the user to change the color of the band; the Thickness selection allows the user to change the thickness of the band displayed.
-DI Line
The Color selection allows the user to change the color of the band; the Thickness selection allows the user to change the thickness of the band displayed.
ADX
The Default Smoothing is 14; however, this setting can be changed by clicking in the respective box and changing the value. If the Checkbox in this section is unselected, this band will be removed from the study.
To save your modified settings to be applied to future charts, click Save As Default. Once this is clicked at all times in the future the settings you have set will be applied to future charts when this study is added.
To return to the Factory Settings, click Factory Settings and then click Save As Default. Once this done at all times in the future the Factory Settings will be applied to future charts when this study is added.
Click "OK" to apply the Average Directional Movement (ADX-DMI) to the selected chart or click "Cancel" or "Remove" to exit the study without applying it.
Click "Remove" to remove the study from the selected chart.
 In New Concepts in Technical Trading Systems, written in 1978 by J. Welles Wilder, Jr., Directional Movement is compared to chasing the end of a rainbow: the closer one gets to it, the more elusive it becomes. The strength of the Directional Movement system identifies whether the market is trending before providing signals for trading the trend.


