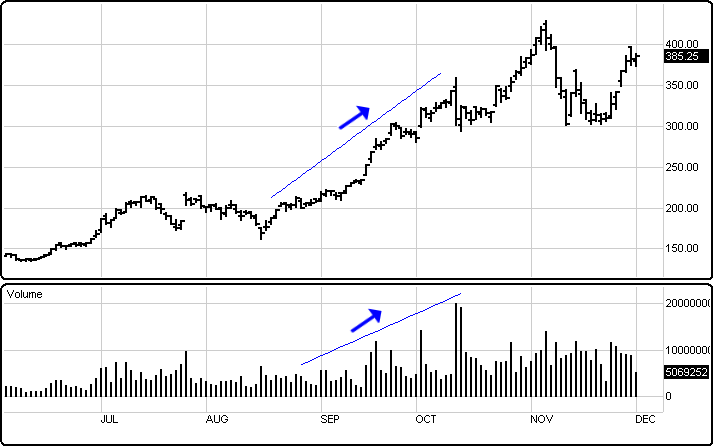
Definition: Volume is a simple calculation tracking the number of stock shares or futures contracts traded during a specified time interval. Volume varies depending on if one is trading an Hourly, Daily, Weekly, or Monthly chart.
The following is an example of how volume is accumulated during the day: As an individual purchases 10,000 shares, the total volume for that stock increases by 10,000. Another individual sells 25,000 at the same price. The volume then increases by 25,000. The total number of shares bought and sold during that day represents the total accumulated daily volume.
Buy Volume + Sell Volume = Total Volume
Volume provides insight similar to how a weather barometer identifies changing temperature patterns. The barometer does not guarantee good or bad weather but demonstrates when conditions are ripe for change. Volume can project when early indications of a significant change could be brewing in a market.
Volume can also provide clues to the legitimacy of a given price move. It can help determine the overall health of an existing trend.
Volume can be used as an indication of liquidity. When the volume is high, the market will be more competitive. However, when the volume is low, the market will be less competitive and close stops are more likely to be triggered.
Volume can also be an indicator of urgency or increased intensity. A measurement of sudden, higher activity can provide early-stage hints that a significant move may be eminent—particularly if volume spikes occur near a major top or bottom.
General Application: Low volume typically occurs during consolidations or re-energizing phases. Low volume can indicate lack of interest, conviction, or certainty at a given time or price level.
High volume can occur at market tops or bottoms. High volume can also occur in a trending market once consensus returns after a pause or consolidation phase.
When volume goes up and price goes up, new buying pressure forms. This could be an excellent time to enter into an uptrend or add to an existing position.

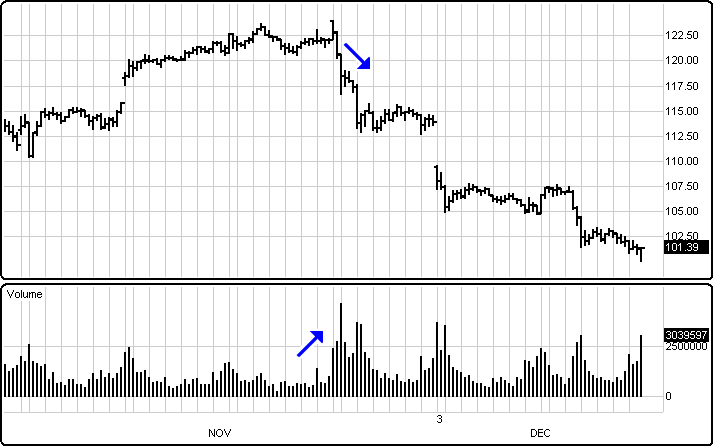
When volume goes up and price goes down, increased selling pressure forms. This could be a good time to enter a short or add to an existing short position.
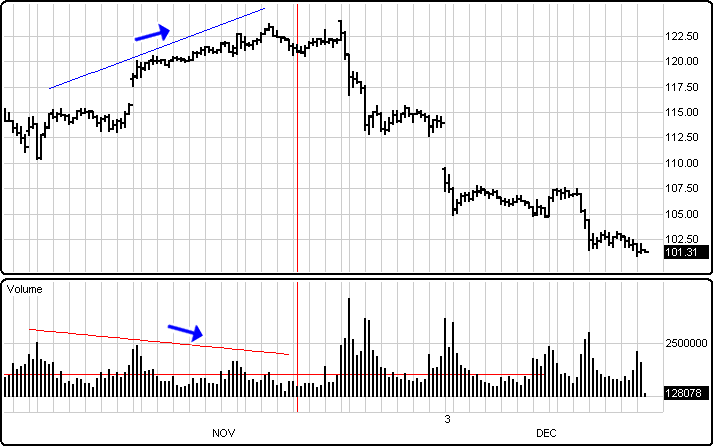
When volume goes down and price goes up, buying pressure dissipates. This could be a good time to tighten a stop in an existing position or consider ways to position early and safely into a new potential downtrend.
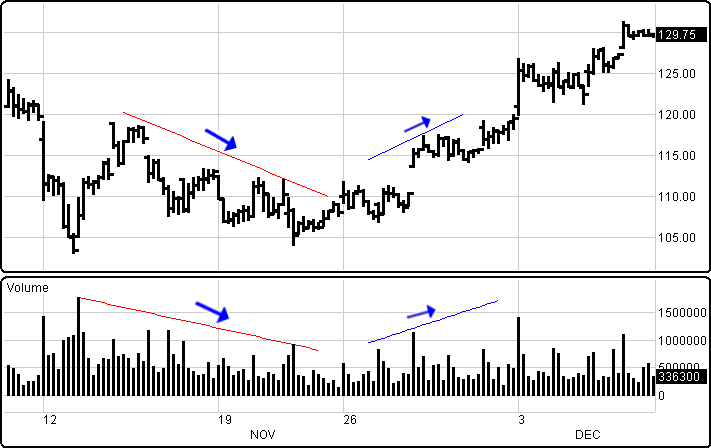
When volume goes down and price goes down, selling pressure is diminishing. This could be a good time to tighten a stop in an existing short position or consider ways to position early and safely into a new potential uptrend.
Menu:
 Line
Line
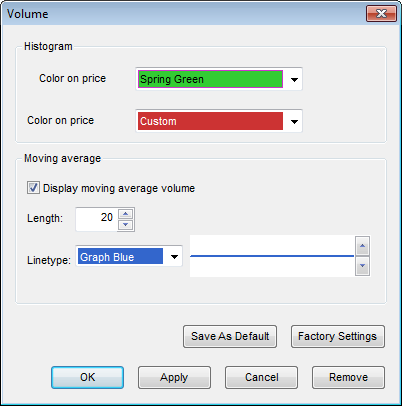
The Color selector allows the user to change the color of the bars, and the Thickness selector allows the user to change the thickness of the bars displayed.
To save your modified settings to be applied to future charts, click Save As Default. Once this is clicked at all times in the future the settings you have set will be applied to future charts when this study is added.
To return to the Factory Settings, click Factory Settings and then click Save As Default. Once this done at all times in the future the Factory Settings will be applied to future charts when this study is added.
Click "Ok" to apply the volume to the selected chart, or click "Cancel" or "Remove" to exit the study without applying it.
Click "Remove" to remove the study from the selected chart.