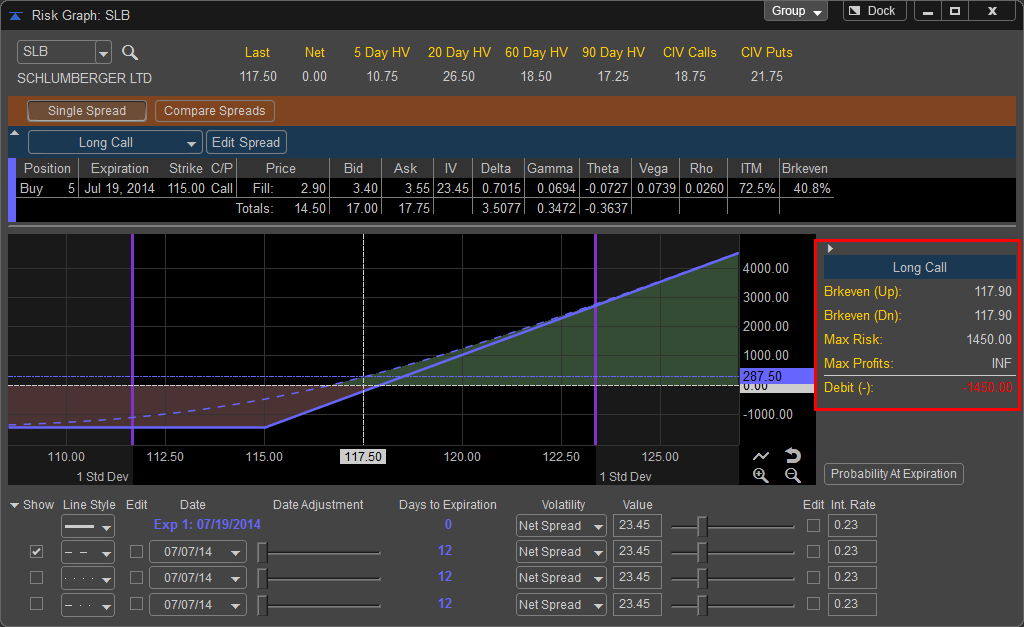
Once the legs are chosen or the pre-built spread is selected the Risk Graph will be displayed and the Position Summary Pane will be populated. The Position Summary is a quick way to look at the positions cost and profit/loss projection.
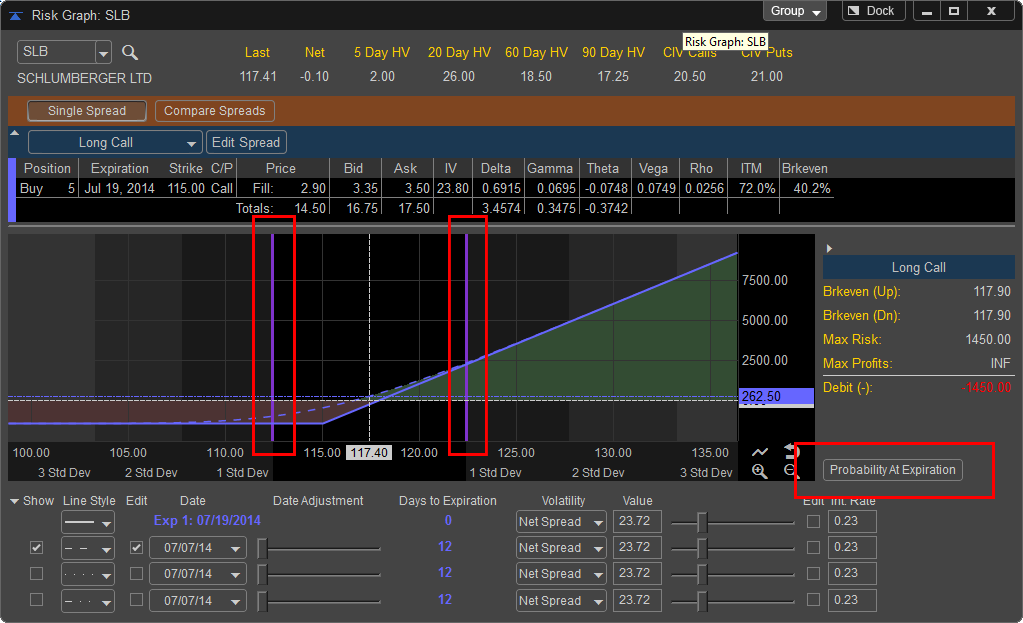
From this window we can see the positions; Max Risk, Max Profit, Breakeven Prices, as well as whether the placing the position will result in a debit or credit to your trading account. In the example below the Long Call position on SLB at expiration has a Max Potential Loss of $1450.00, which is also the debit the trade will create in your account to take the position. Since this is a simple Call trade if the option expires with no value you would lose the initial cost of $1450.00.
Since the profit on the position is correlated solely to the movement on the underlying stock and the stock could theoretically keep rising in price with no limit the position has an INF or infinite potential profit. The Breakeven prices both up and down are modeled based on the day the option expires with the current volatility. On the day of expiration for this position to be at breakeven or no loss the underlying stock needs to be at a price of 117.90. Anything higher would result in profits, lower in loss. This forecast is modeled in the main Risk Graph by the solid blue line.
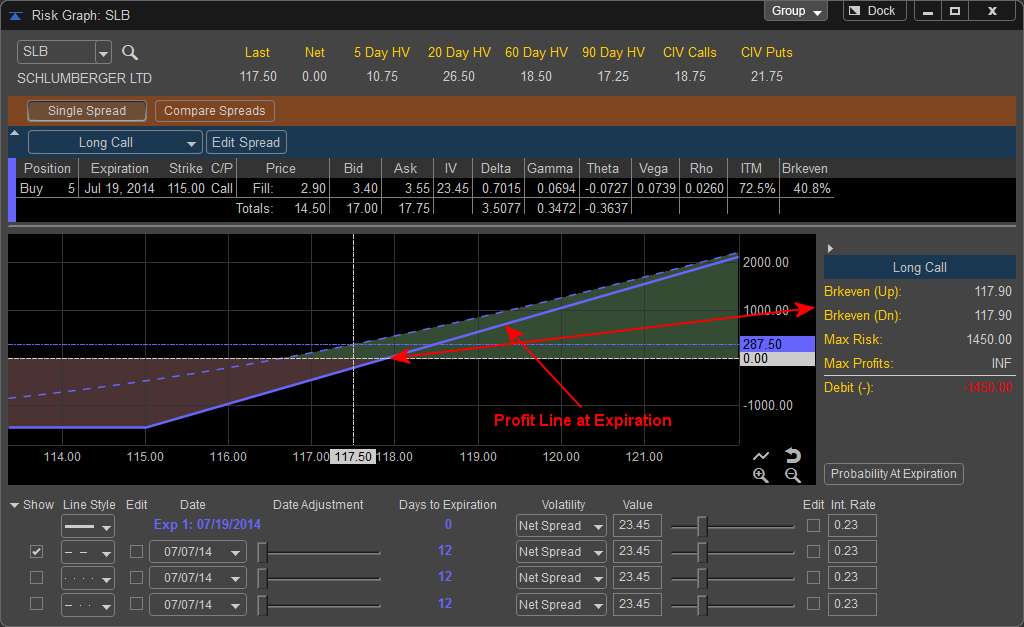
The default Risk Graph models two forecasts by default. The first is represented by a solid blue line and forecasts the position on the day of expiration using the Net Spread for Volatility. The second which is a dotted blue line represents the position at the current trading day. The scenario pane in the lower left hand corner of the chart displays the days to expiration with calendar date, volatility, and interest rate that the blue line is modeled after and other models are based on.
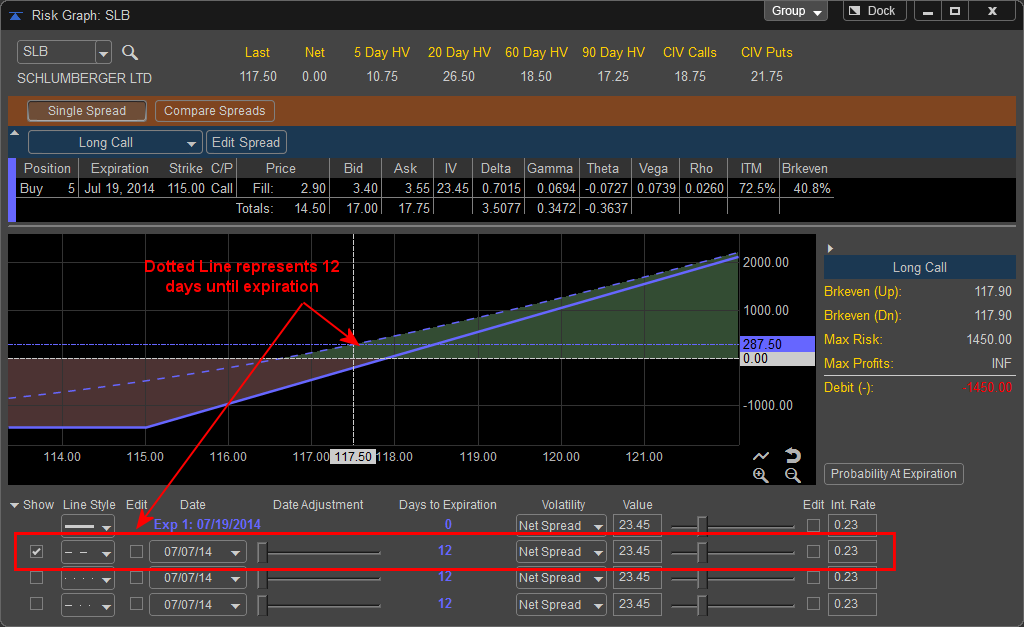
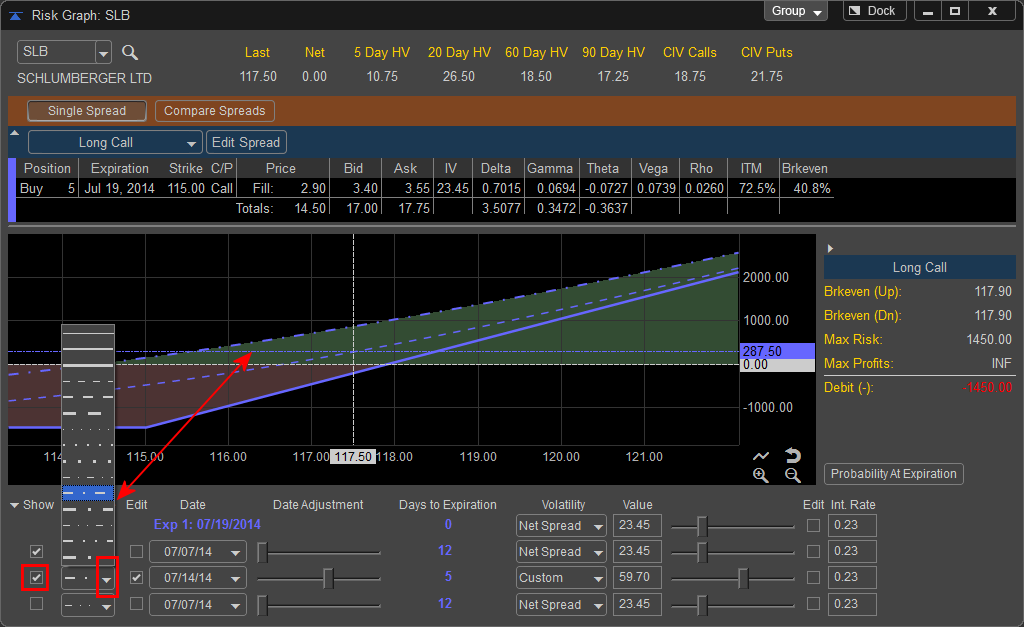
The model forecasting profits and loss at the day of expiration (solid blue line) cannot be removed from the risk graph; however you can add or remove the additional forecasts by checking or unchecking the boxes under the Show column in the scenario pane. The Line Styles can be selected by left clicking on the drop down menu under the Line Style Heading.
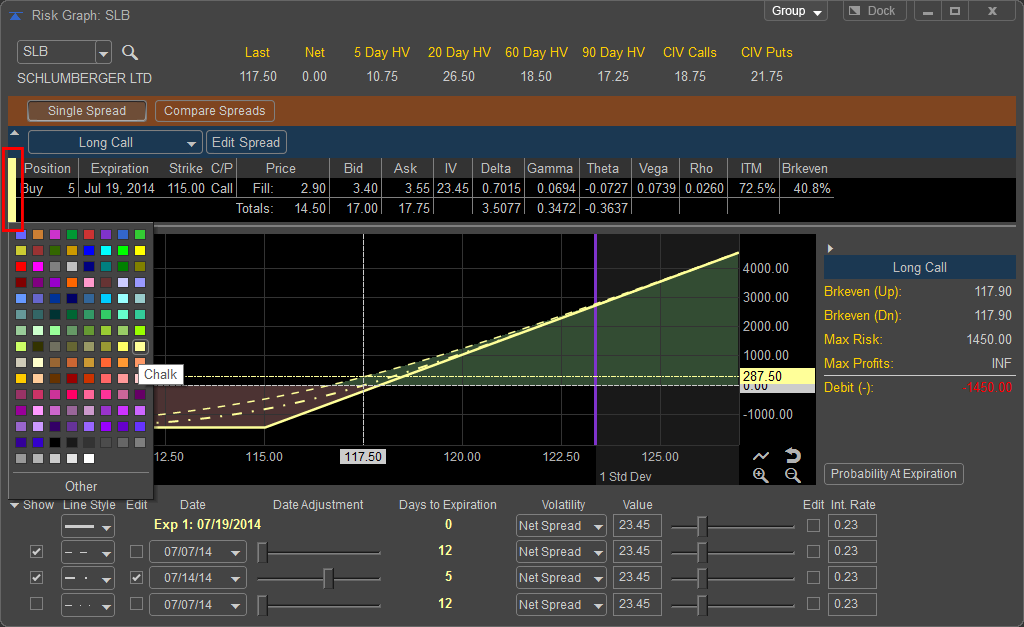
In addition you can change the colors of the Profit Loss Line by left clicking in the colored area of the position pane.
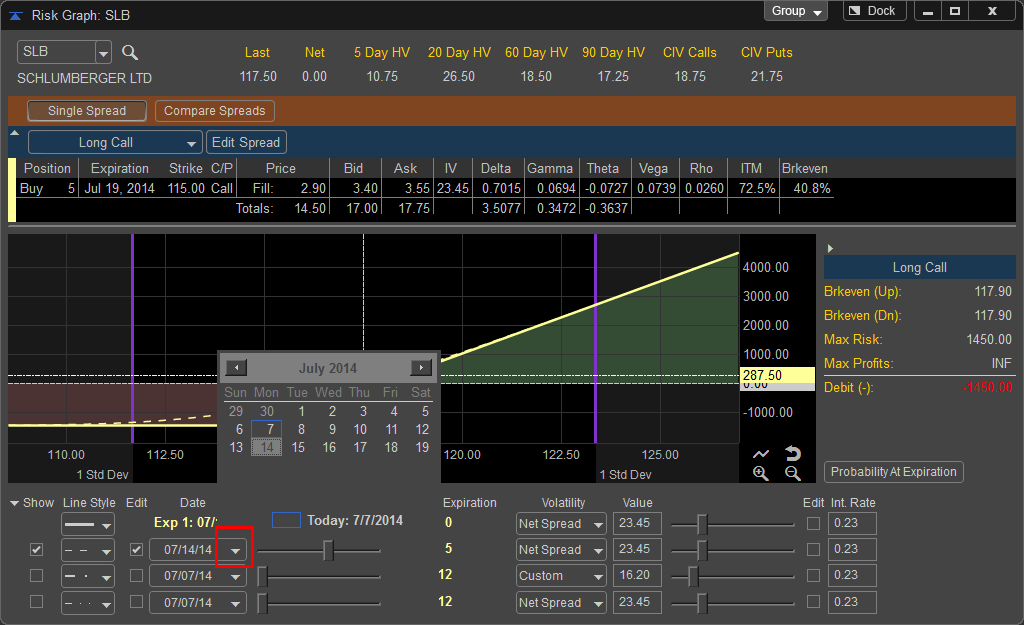
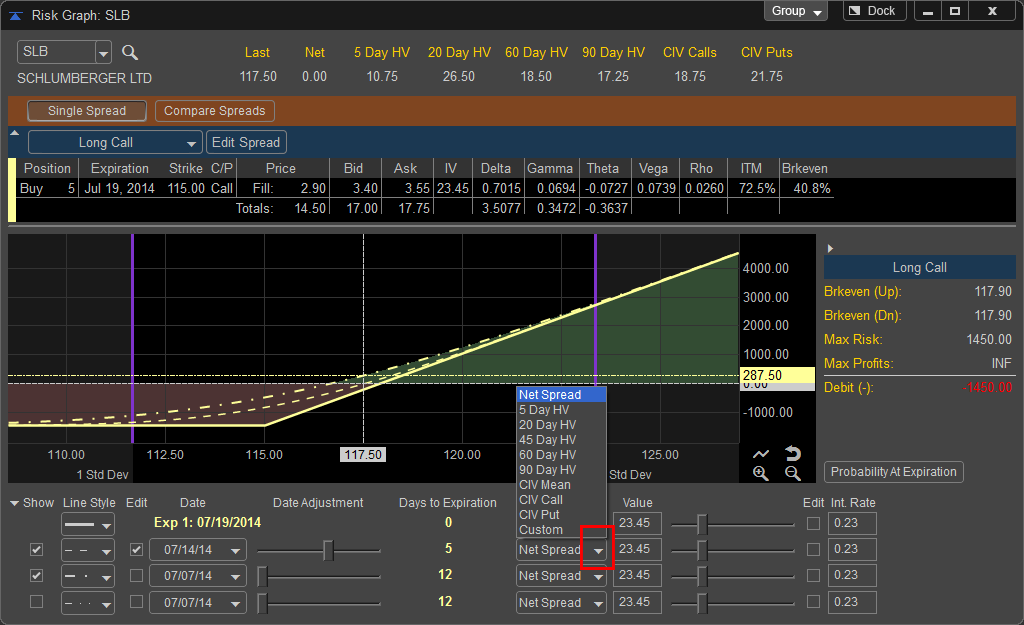
Additional Models can be adjusted to reflect dates closer to expiration by left clicking on the Date drop down menu as well as moving the Date Adjustment slider bar to the right. The Days to Expiration column will countdown as you move adjust the date or move the slider bar to illustrate how close to expiration the model is. The Date of July 14, 2014 is selected for the second model which is 5 Days to the option expiration.
Changes in Volatility can be modeled by manually typing in a new value in the Volatility Value field, choosing from the pre-selected volatility values in the volatility drop down menu, or adjusting the slider bar.
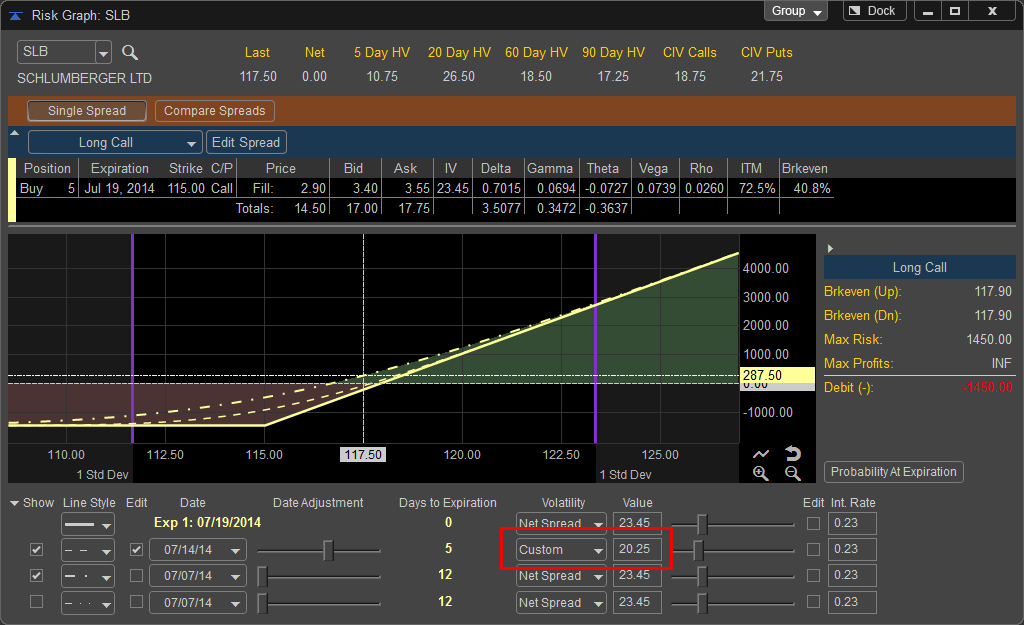
Custom value of 20.25% entered into value field, notice the Volatility drop down resets to Custom.
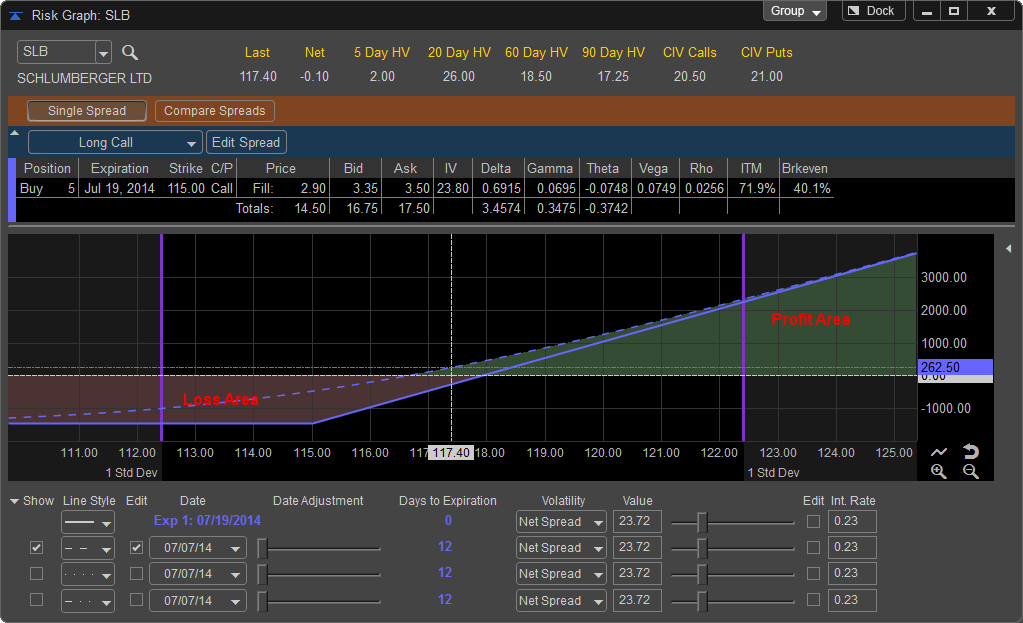
The Risk Graph is color coded to make interpretation as simple as possible. Areas shaded in the color Red indicate prices in which the position will be losing money, price area that is shaded in Green represents profitable areas of the position.
The additional grey shaded areas represent prices that fit market potential market movement based on standard deviations. The area on the Risk Graph in black represents the price range of a one standard deviation move or a 68.2% probability that the underlying price will be in this area at expiration. The light grey shaded area represents two standard deviations or 95.4% and the dark grey area represents three standard deviations or 99.6% probability. These areas can be helpful for spread building to choose the correct price ranges of the spread.
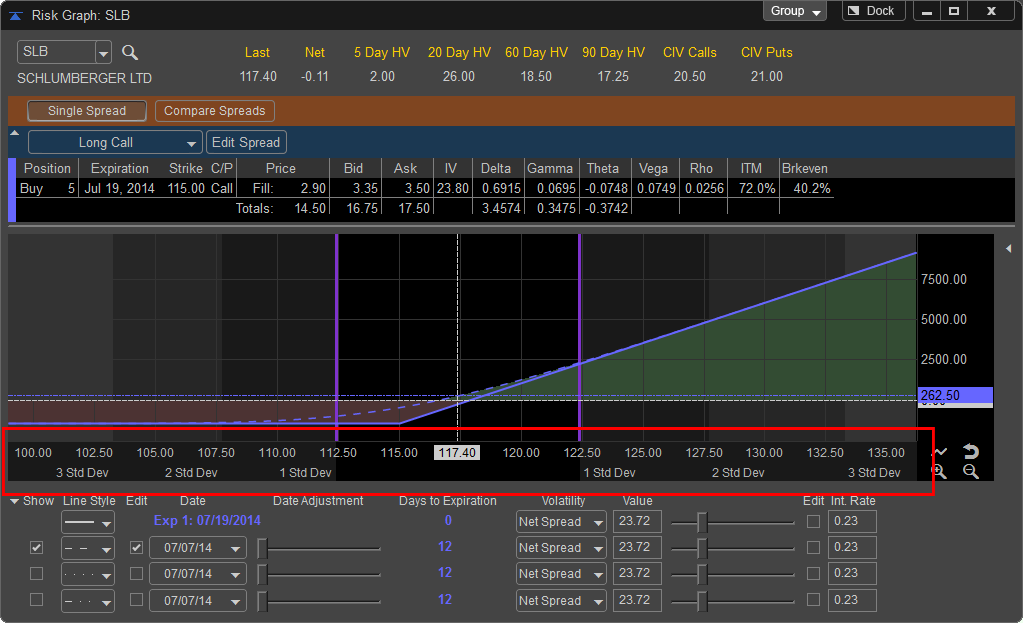
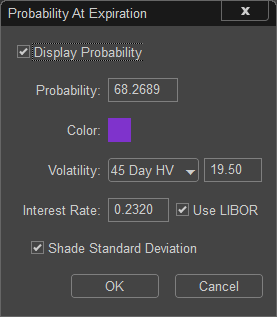
The Risk Graph also supports a custom range that defaults to one standard deviation and is displayed by purple horizontal lines on the Risk Graph. These lines can be adjusted by left clicking on the Probability at Expiration button on the bottom of the Spread Summary Pane.
From this window the Bands can be enabled or disabled by unchecking the Display Probability option. In addition the Probability can be adjusted by manually changing the value in the Probability field as well as color options and source for Volatility. You can also disable the standard deviation shading by unchecking the Shade Standard Deviation selection Box.
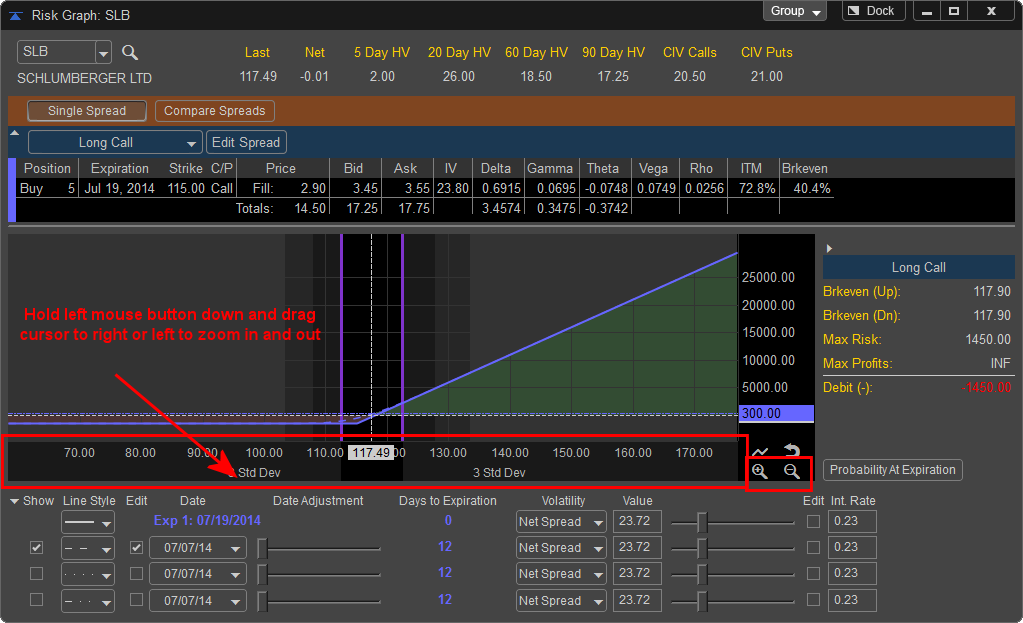
You can zoom in or out of the Risk Graph by left clicking on the horizontal price axis at the bottom of the graph; this allows you to project additional gains or losses as the underlying stock has larger moves. In addition, you can left click on the plus and minus icons in the lower right hand corner of the Risk Graph to zoom in and out.
You can adjust the position of the Risk Graph by moving the cursor into the Risk Graph chart and holding down the left mouse button and dragging the chart either right or left. Once you reach the desired view depress the left mouse button.
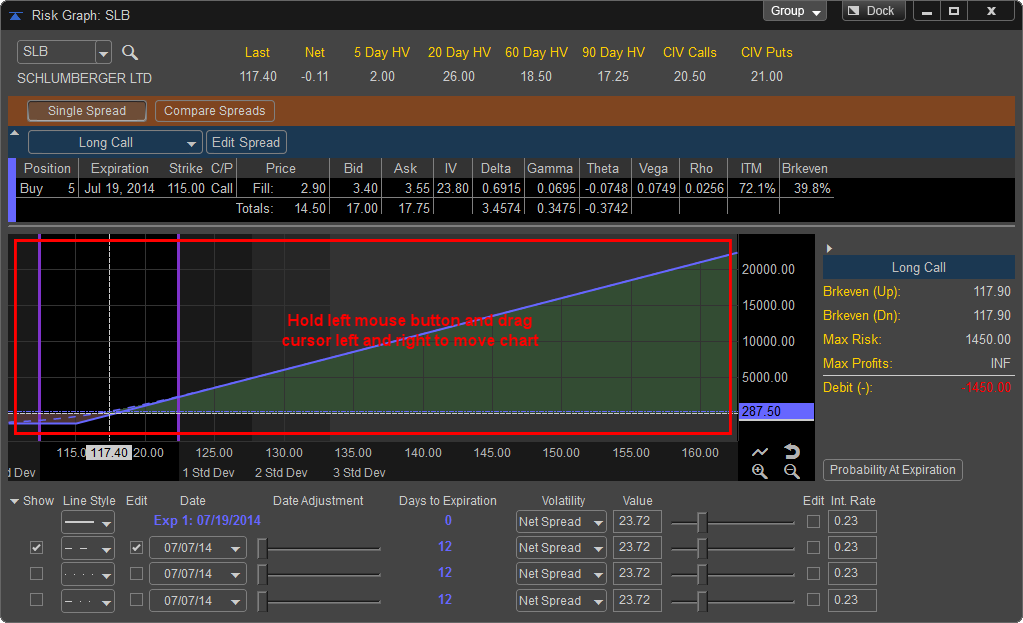
To Reset the Risk Graph back to the default view left click on the reset button in the lower right hand corner of the graph.
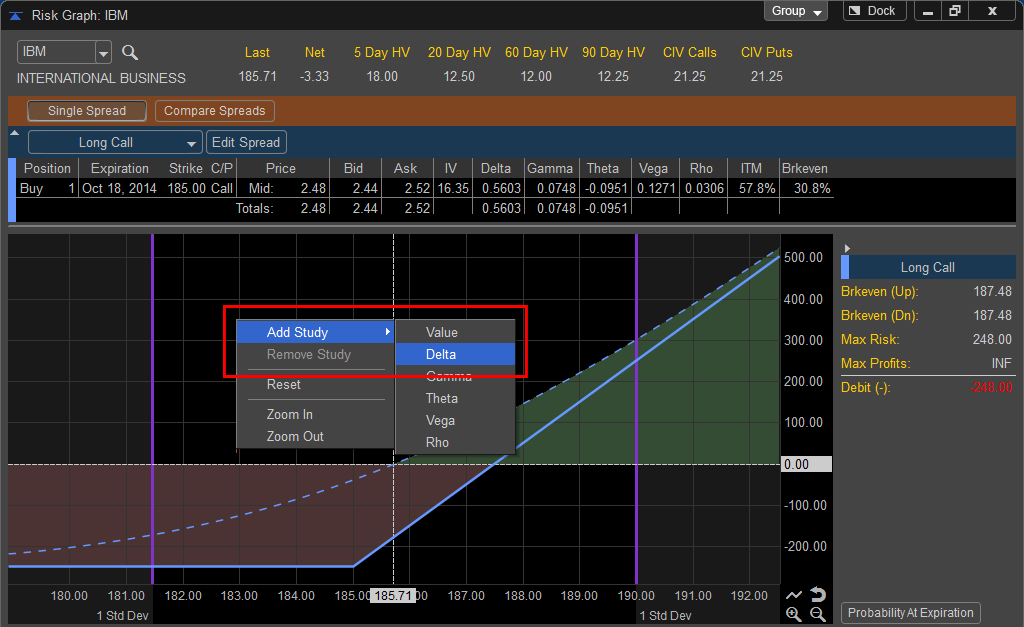
In addition a Study Pane can be added to the Risk Graph to show the changes in Spread Value or any of the Greek Values. Right click on the Risk Graph and choose Add Study and select the parameter to add to the Risk Graph.
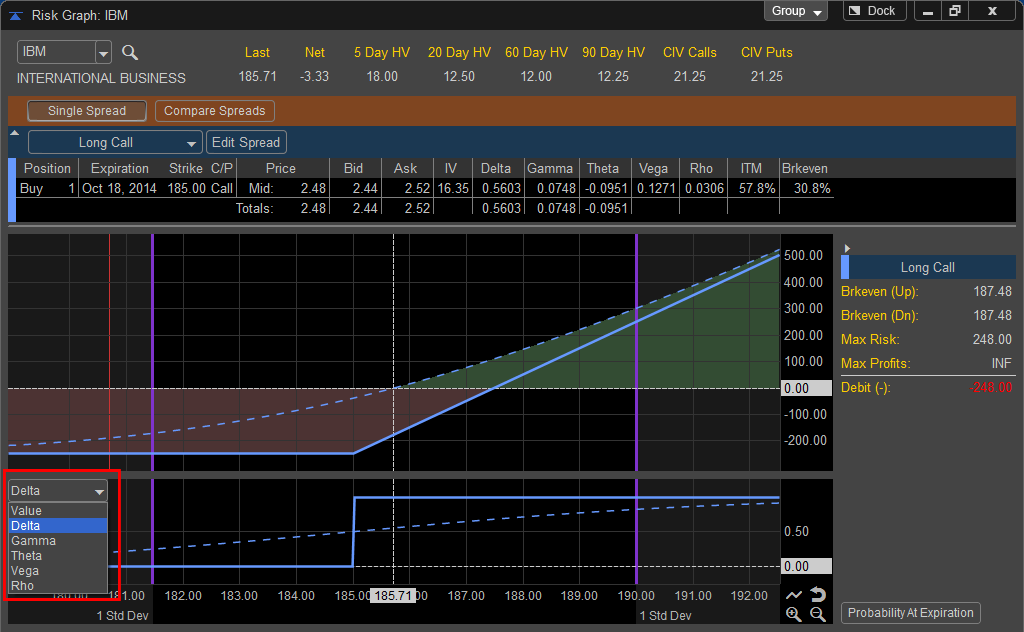
Delta is now displayed at the bottom of the Risk Graph and illustrates the changes in Delta as the position moves based on changes in the underlying, to change the pane to a different value left click on the drop down menu in the upper left hand corner of the study pane.
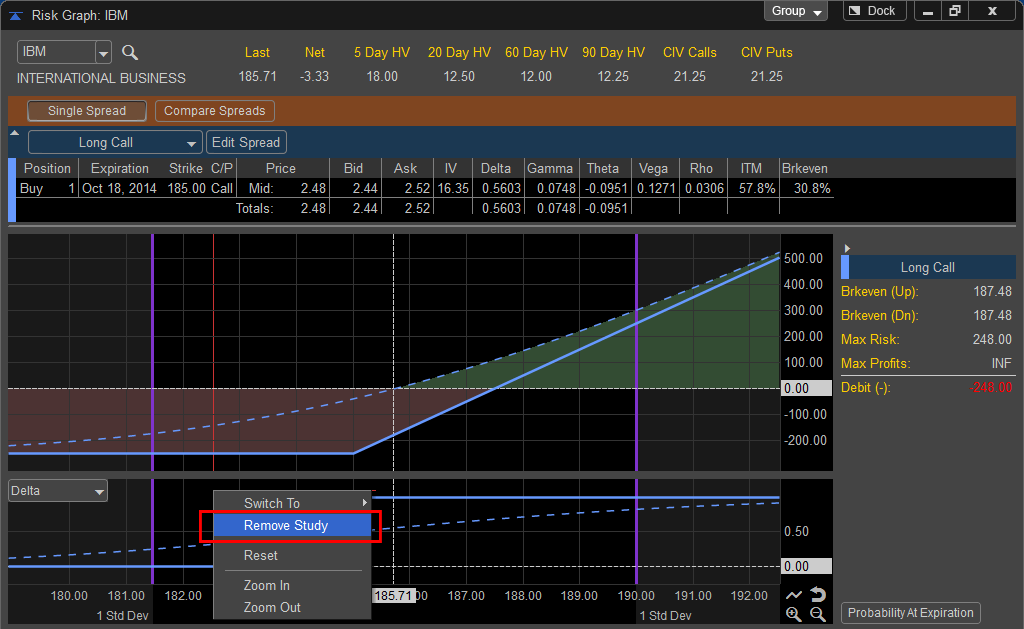
To remove the study left click in the study pane and select Remove Study.
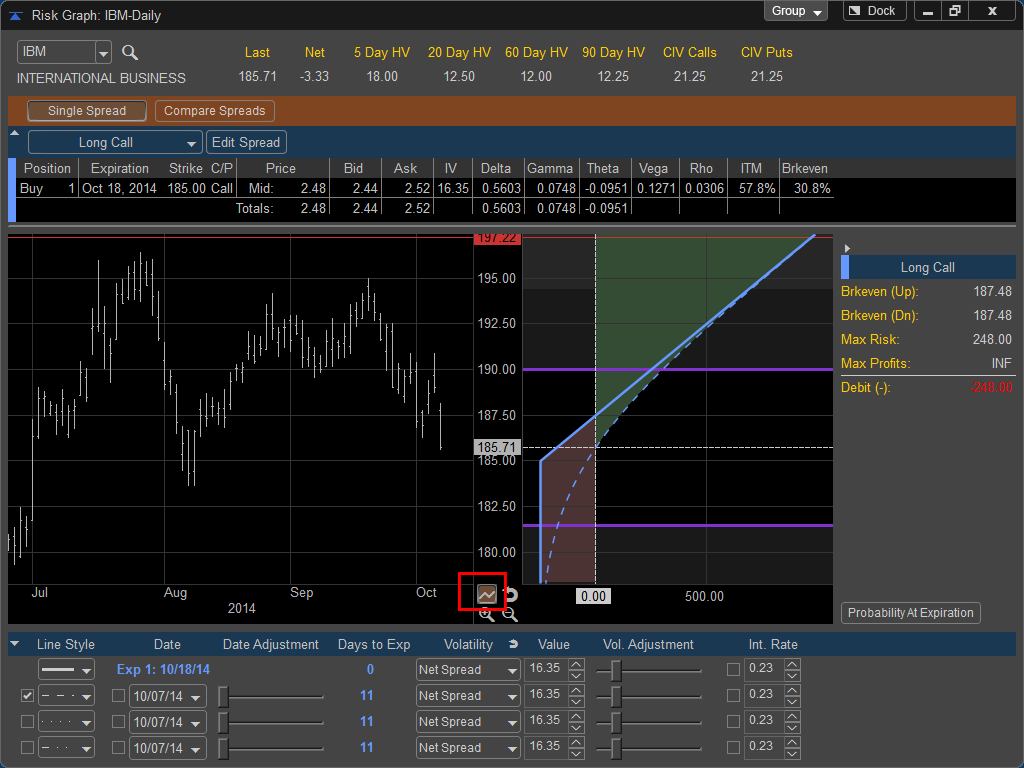
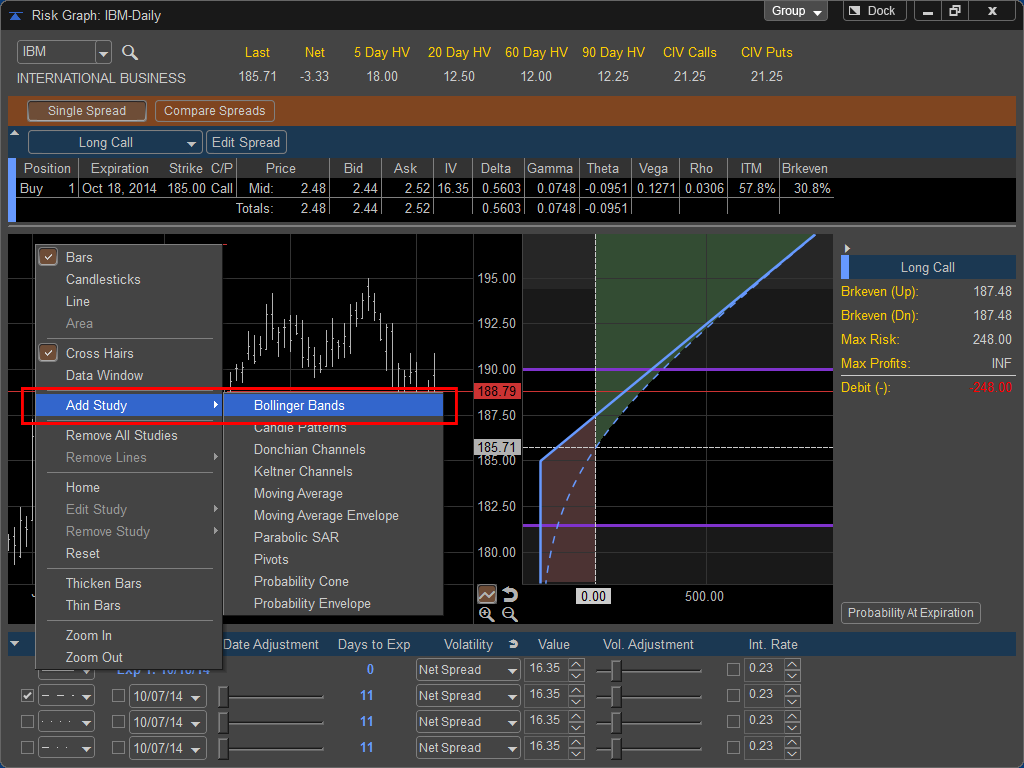
You can also chose to display a copy of the Daily chart of the underlying stock next to the Profit Loss graph by clicking on the SHOW CHART icon in the lower right hand corner of the Risk Graph. This is helpful to identify key areas on the chart and compare them to profit and loss on your spread or option position in addition you can edit the chart options and add select indicators to the chart by right clicking in the chart window to open the chart properties. To Remove the chart from the Risk Graph left click on the chart button to close it.