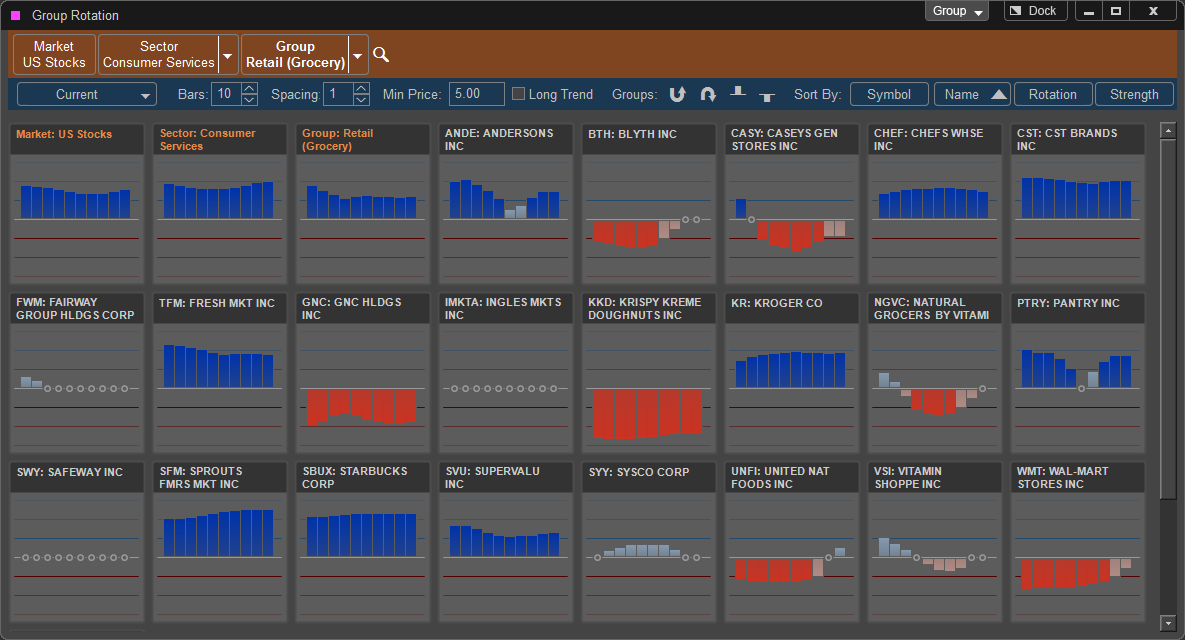

The Group Rotation tool is designed to help the investor identify potential trends in various stocks or baskets of stocks grouped together based on their business activities. In addition to identifying the trend, the Group Rotation tool provides the user with a quick way to measure the strength of the trend. Prior to discussing this, we need to discuss Sectors and Industry groups, and the differences between them.
Market Index:
Several methods are used to compute an index that represents the U.S stock market. The most common ones are the Dow Jones Index and the S&P 500 Index. The Dow Jones is an index calculated using 30 of the largest companies in the market, while the S&P 500 is an index calculated using 500 larger companies.
These indexes provide the trader with a representation of a basket of stocks. While the Dow Jones index is perhaps the most commonly quoted index, it is a very narrow index and only accounts for 30 stocks. The S&P 500 index is considered to be a better overall index as it takes into account 500 stocks of larger companies. The S&P 500 index collectively accounts for almost 70% of the market’s value, and therefore is regarded as a better overall representation of the market.
While the S&P 500 Index is a broader Index, it still does not account for the approximately 8000 individual stocks listed on the NYSE, Amex and Nasdaq. It is therefore helpful for investors to group various companies based on the type of business they are engaged in. To provide a better business categorization, these 8000 stocks are grouped into Sectors and Industry Groups.
When companies engaged in similar business industries are combined together, the investor can easily compare one business group versus another business group, or focus on stronger companies within a particular business group.
Sector:
The U.S stock market (approximately 8000 individual stocks listed on the NYSE, Amex and Nasdaq) are categorized into 10 different sectors. Each sector represents a large segment of the economy. The 10 sectors are as follows:
|
Consumer Discretionary |
Industrials |
| Consumer Staples | Information Technology |
|
Energy |
Materials |
| Financials | Telecommunication Services |
|
Healthcare |
Utilities |
Sector Trend calculations:
The Sector Trend is a change of momentum study applied to Sector and Industry group indexes, and individual stocks to calculate the direction of the trend and measure the strength of the trend. The study is completely independent of how the Sector and Industry indexes are calculated or weighted, and the volume data is not part of the calculations. It uses a proprietary combination of widely used formulas such as standard deviation, moving averages and average true range values to identify the trend in a Sector or Industry index or an individual stock.
Interpretation
Once a trend is identified, the strength of the trend is derived by normalizing to the average true range of the underlying index or stock. This normalization provides trend and strength values that can be compared between the underlying Index and the stocks listed in that index. In addition, to visually accentuate the change in trend from negative to positive, the calculation model includes a modified custom log transformation to the scaling. All calculations are performed in real time on the server level which frees up the customer’s computer resources for trading purposes.
When the Trend is not discernible it is considered to be neutral and is assigned a grey color and indicated as a small circle. As the trend starts to develop the Group Rotation will indicate the direction by placing a light blue bar above the "zero line" or grey mid line, this indicates a potential up trend beginning. Once the trend develops into a strong up trend the Group Rotation will color the bar dark blue and the market is now in a strong trend up. A down trend beginning to form is indicated by a move below the grey line and first indicated by a light red bar, once the trend is confirmed down the bar will change to dark red. If the strength bars are making higher highs or lower lows this can interpreted as the trend is continuing, as the highs get lower in an up trend this is considered to be a weakening trend. In the down trend the lows will get higher.
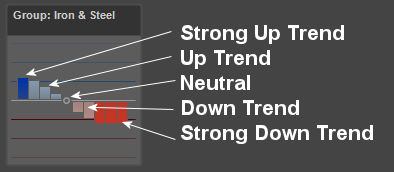
The general concept of the Group Rotation is to trade directionally with the overall strength of the market, sector, and group. If the market is in a strong up trend verify that the stock you are trading is also in a strong group and sector for best results. If the market is weak you can verify that the sector or group you are trading in remains in a strong up trend for best performance. If you are bearish on a stock it is best if the stock is in a weak group or sector if the market is overall strong up. Additionally for finding trend breakout candidates you can look for a Group Rotation pattern, this is seen when the market switches from neutral to down or neutral to up. These patterns are seen when the market is potentially changing directions. You can sort the Group Rotation window to highlight these changes as well as organize the sectors, groups, and individual stocks by strength and weakness as explained below.
In addition you can add the strength to your Matrix Scans for further confirmation.
General Operation
The default Group Rotation window will open with the overall Market and the ten market sectors displayed. You can right click on each individual gauge to and select chart to open a chart for either the market or sector displayed.

To expand an individual Sector to display the Industry Groups within the sector double click with the left mouse button on the sector you wish to expand. In this example we have expanded the Sector:Financials to show the Industry Groups within that Sector.
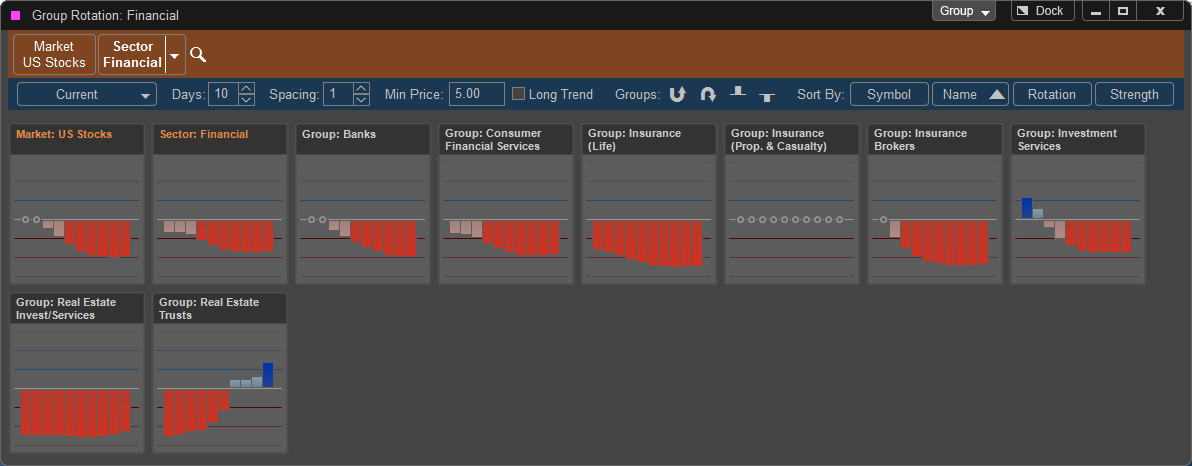
You can now double click on an individual Industry Group to expand that group to show the individual stocks (optionable only) that are in that group. To open a chart of the stock right click on the strength gauge and select Open Chart.
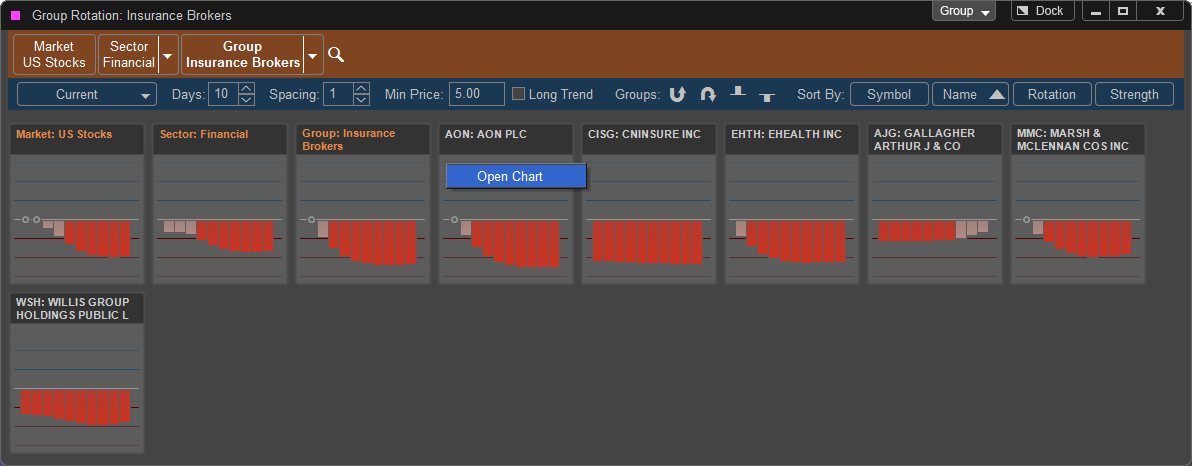
If you wish to select another Sector or Industry Group to display you can either return to the default Group Rotation Screen by left clicking on the Market US Stocks button or selecting a new Sector or Group from the down menus.
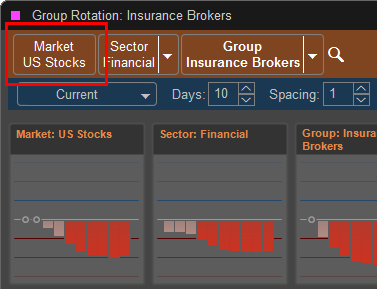
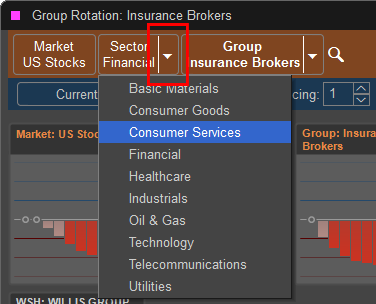
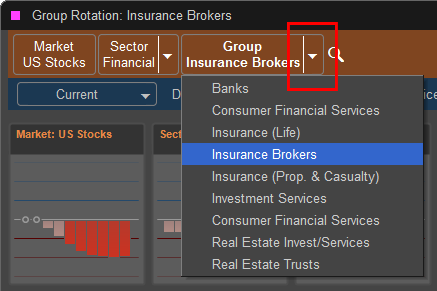
If you wish to select another Sector or Industry Group to display you can either return to the default Group Rotation Screen by left clicking on the Market US Stocks button or selecting a new Sector or Group from the down menus.
Display Options:

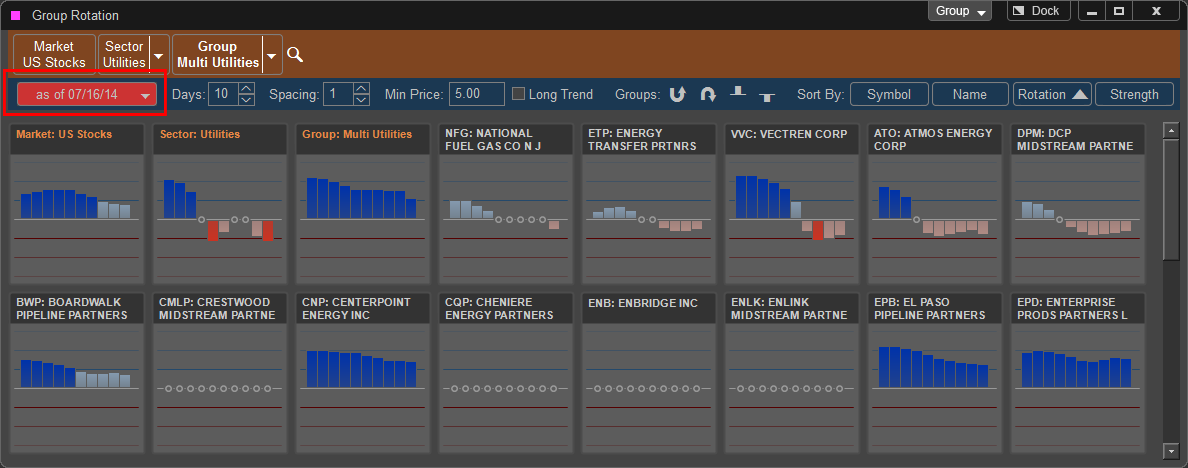
Look Back - Allows the trader to select a historic date to study what the condition of the Market, Sectors, Groups, and stocks strength on that day. To select a new date left click on the Current button to select the new date. In the example below the date of July 16th has been selected, and the Group Rotation is now displaying the strength conditions on that day.
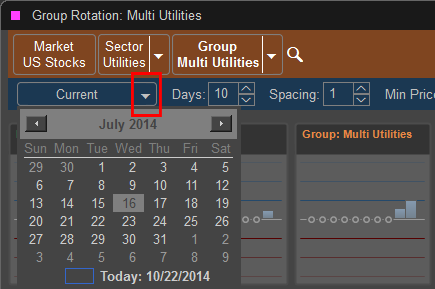
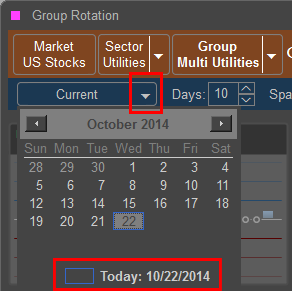
To restore the date to today's date select the drop down calendar and press Today on the bottom of the calendar.
Bars - Adds additional bars to the strength gauge to show longer history of market, sector, group, and stock performance.
Spacing - Increases the space between each bar of the strength gauge.
Min Price - Filters out individual stocks that are below the set price when looking at individual groups.
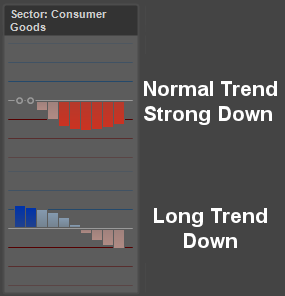
Long Trend - Adds an additional column to the strength gauges that shows a longer term look at market strength, in this case one bar on the gauge
represents more time than the top normal length graph.
Groups - Allows the user to sort the Industry Groups by Strength and Rotation Up and Down. If sorted by Rotation the Groups will be displayed in order of which one rotated from Up to Down or Down to Up the most recently (limited to the last three days.) By selecting strength only the groups trending up or down will be displayed. In the example below the groups are sorted by Strength with up trends only displayed.

Sort By:
Symbol - Sorts the Results of Stocks within individual groups alphabetically by Symbol
Name - Sorts the Results of Stocks within individual groups alphabetically by Company Name
Rotation - Sorts Results of which Sector, Group, or Stock has rotated Up or Down most recently or longest time since.
Strength - Sorts Results of which Sector, Group, or Stock has highest to lowest or lowest to highest strength