DT Options Projection Tool
The DT Options Projection Tool is designed to allow the option trader to quickly project potential profits and losses of option trades based on changes to the underlying stocks price and the volatility of individual options in the trade. In addition to projecting the dollar amount of profit and loss the trader can also project changes in the various Greek values as the price and volatility of the underlying changes over time until expiration.
The DT Options Projection Tool is unique in the fact that options traders typically have to rely on risk graphs which show static price and time values whereas the DT Options Projection Tool allows the trader to model actual market conditions as prices and volatility move toward expiration. This allows the trader to see the position’s profitability and Greek values from beginning to end unlike a standard risk graph where a trader would see the profit and loss of their position on one day of the trade.
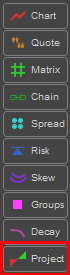
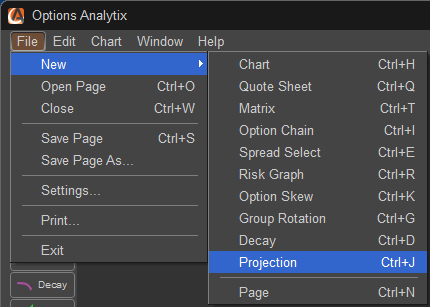
Open the DT Options Projection Tool
The DT Options Projection Tool can be accessed by left clicking on the Project button from the toolbar located on the left side of the screen or by left clicking on FILE, NEW, and PROJECTION. In addition the user can press CNTRL – J on the keyboard to open the Projection Tool Window.
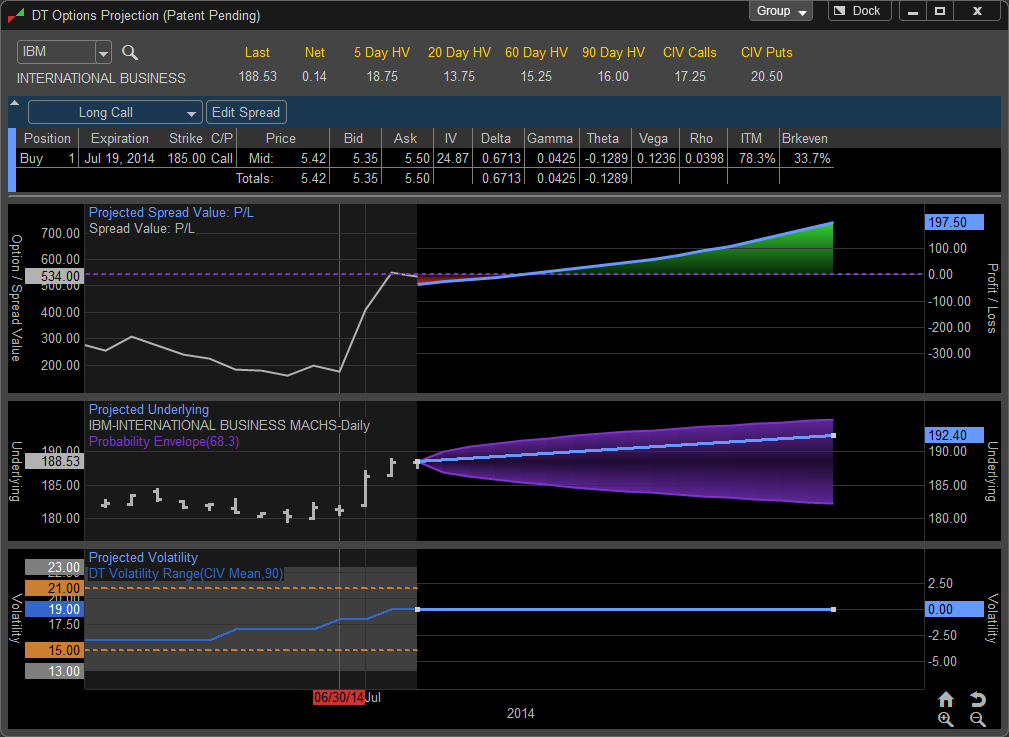
DT Options Projection Tool Layout and Overview
The Projection Tool has 4 panes which all have separate functions but work together to identify the various outputs such as Greek values or profit and loss of your options position.
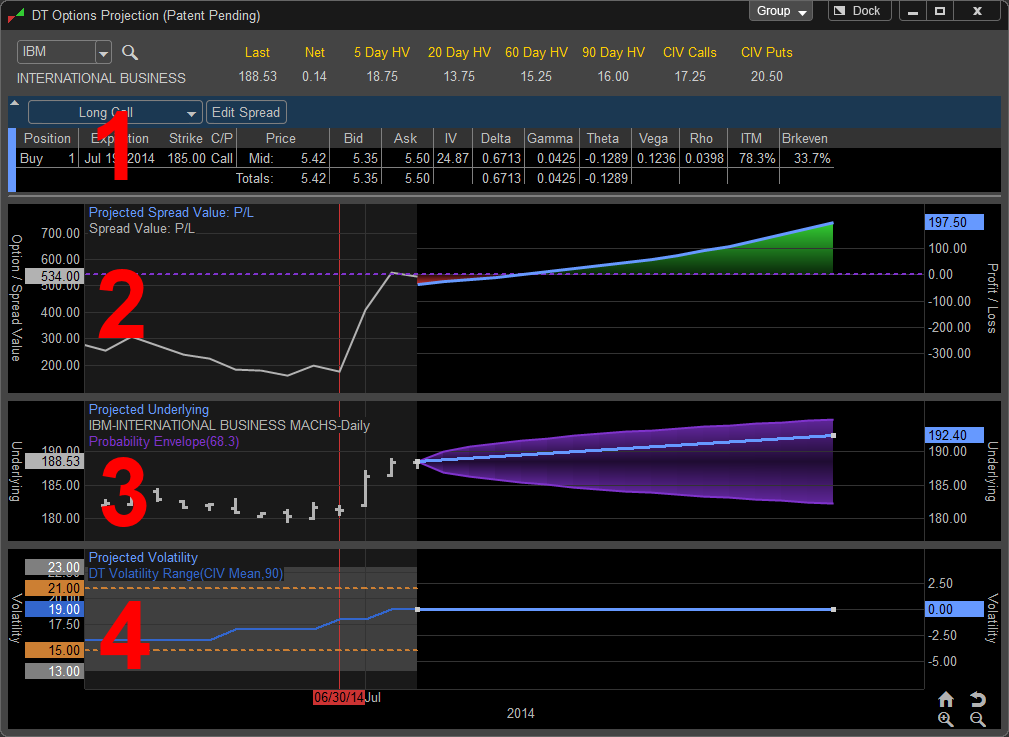
Pane # 1: Position Input and Summary
The first pane of the Projection Tool is the position setup area at the top of the window. This area allows the trader to select a stock symbol to begin building the projection. The last price of the stock as well as summary of Historical and Implied Volatility is provided as a quick reference. Also on the left of the pane is a position summary showing the option spread or position that is being displayed in the Projection Tool along with the trade debit or credit, breakeven prices and max profit and loss for the trade.
The trader can build an options position with up to eight option legs and also the ability to add a stock leg for trades such as covered calls. In addition, the user can select from over 30 pre-built spread templates in which the software will automatically build the spread with the proper option and stock legs required to complete the spread. From here the user can manipulate the pre-selected option and stock legs to their individual preferences based on strike or expiration. This section of the Projection Tool also displays the current Bid, Ask, and real time Greek values of the options involved in the spread. Once the user selects the spread or option leg to simulate the lower three portions of the Projection Tool will populate, these lower panes work together to help the trader simulate the trade until expiration.
Pane # 2: Option / Spread Value
As the trader makes additional changes to market conditions (Price and Volatility) the Option / Spread Value pane will recalculate the profit and loss for the position based on the changes the user inputs. As the user moves the cursor they can see how the position changes value over time as the position gets closer to expiration. If the position is profitable the area chart in the top pane will be shaded green and the dollar amount of the gain is presented in the right chart axis, if the position is losing the amount of loss will also be reflected in the chart axis and the area chart will be displayed as red moving below 0. The left shaded portion of this pane represents a historical look at the value of the selected option or spread based on the history of price movements of the underlying issue.
Pane # 3: Underlying
The pane central to the Projection Tool is the middle pane the, Projected Underlying section. From this pane the trader can simulate market conditions in a chart like mode that matches what they feel the market will do until the time the chosen option or option spread expires. As the price of the underlying stock is adjusted the Option / Spread Value pane will adjust to reflect these changes and show the updated profit and loss or the value of the option Greek which was selected to display. To help illustrate potential price movements a probability envelope based on a one standard deviation move is shown on the underlying pane to help guide the trader to make realistic price projections.
Pane # 4: Projected Volatility
In the Projected Volatility pane the user can simulate changes in volatility and how it will affect the positions overall profit and loss. This is unique in that normally a trader can impute this on a risk graph and see a static view of a single date. In real trading however, both price and volatility do not typically move at great intervals all at once, a risk graph can a 10% move in volatility in 30 days but cannot illustrate properly how the positions profit and loss will move gradually during this 30 day run up. Often times in trading the position may reach maximum profits during this run up and it’s in the best interest of the trader to take profits early before that 30 day period. The standard risk graph cannot show this as it’s a static display of price and volatility on one single date. Also, the Projection Tool allows the user to independently adjust legs separately in multi leg option trades..