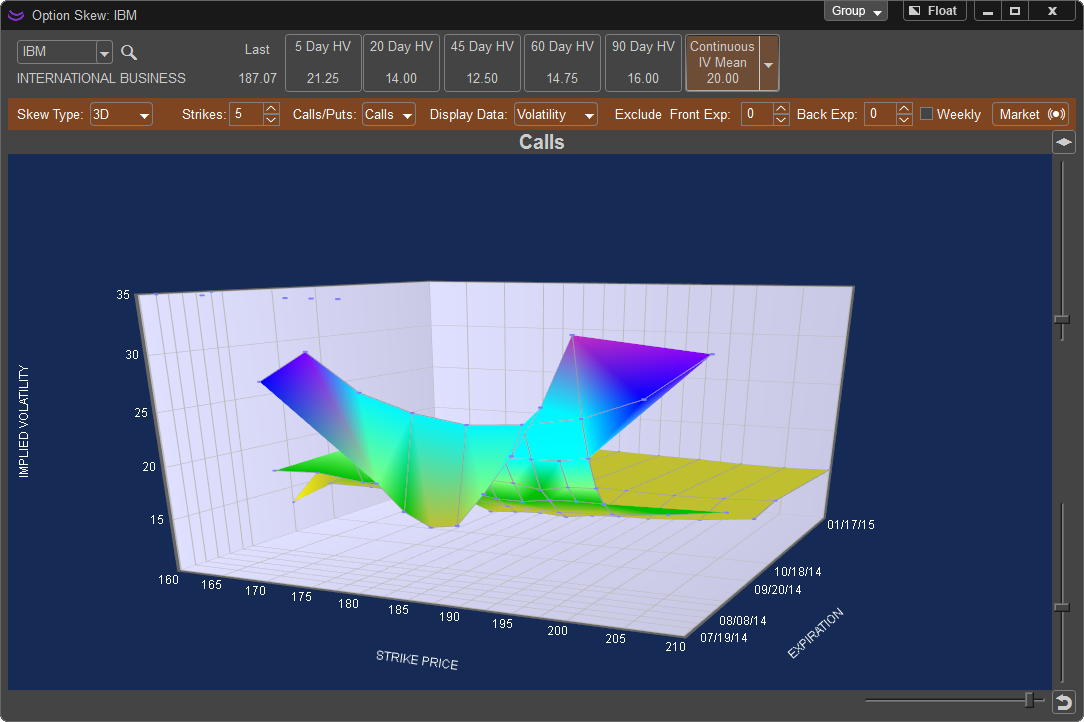
3D:
The Skew chart can also be viewed in 3D. This view adds a third axis which shows the Option Expiation Date along with the Strike and Implied Volatility and displays it in a 3D form. By default the 3D Chart will show all available expirations with the option of choose how many strike prices to show.

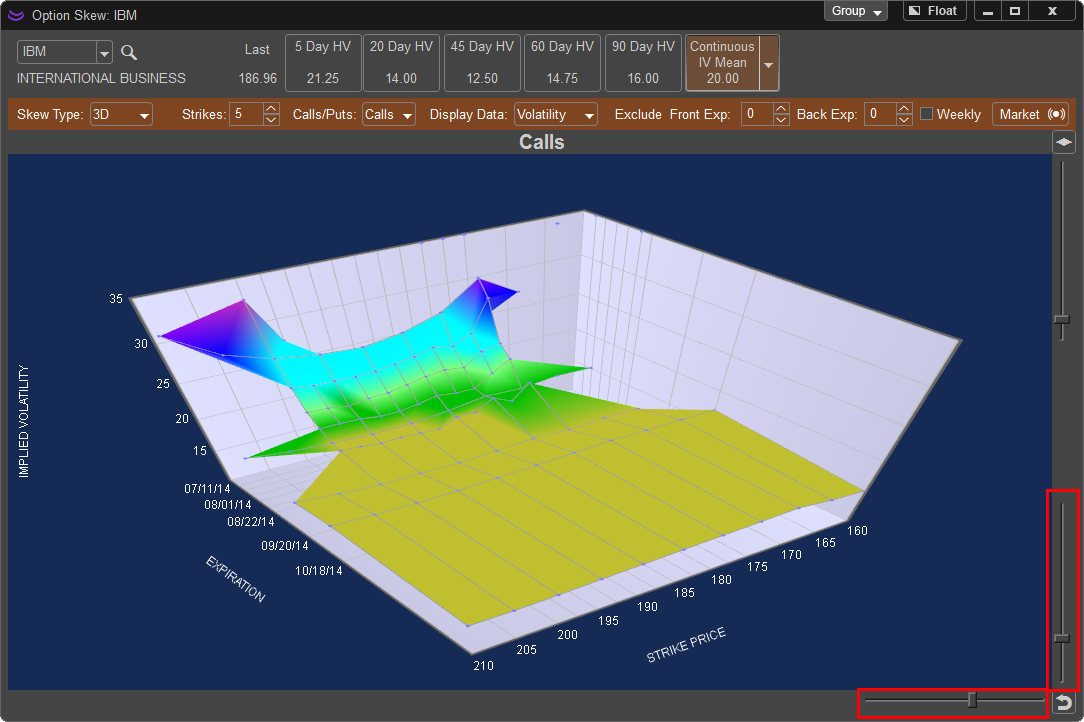
When the 3D Skew Chart is displayed you can rotate the chart on both the horizontal and vertical axis by moving the slider bars in the lower right hand corner of the Skew Chart Window.
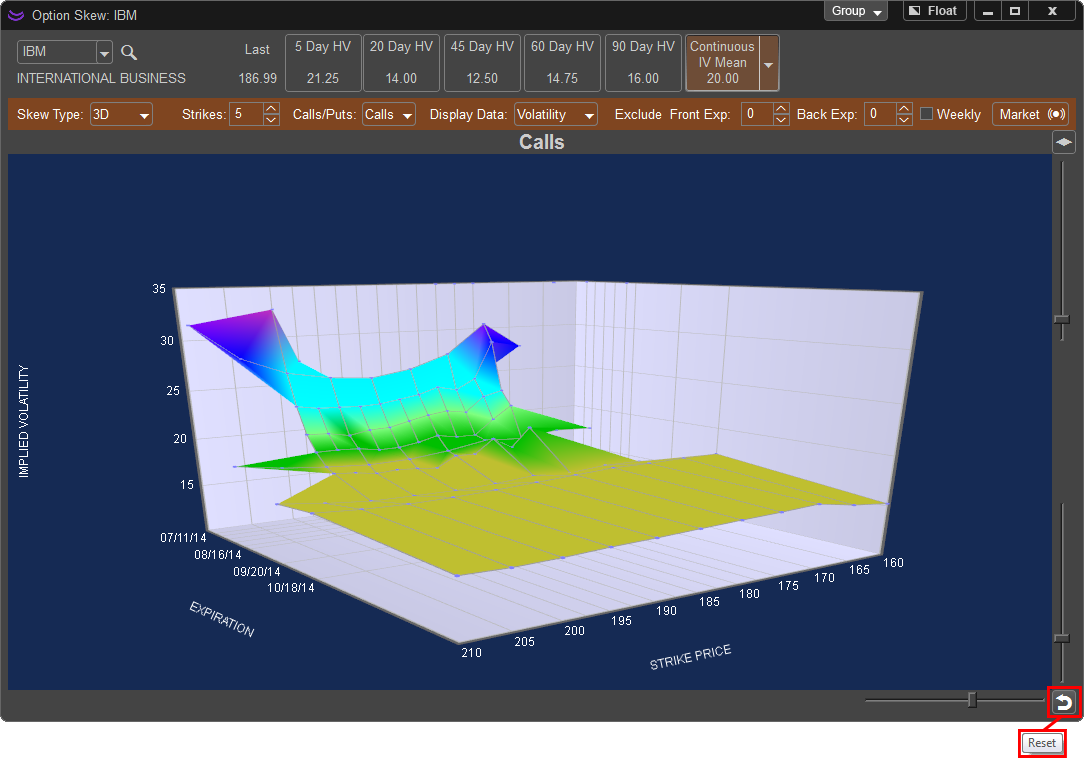
The chart can be reset to its default visual settings and axis by left clicking on the reset button on the lower left hand corner of the skew chart window.
In addition you can add a transparent adjustable plane to the 3D Skew chart to identify areas where Volatility is breaking levels. In the below example the Skew Plane is activated by left clicking on the ![]() button. Once the skew plane is active adjust the level by holding down the left mouse button and dragging the slider bar until the plane is set to the desired level.
button. Once the skew plane is active adjust the level by holding down the left mouse button and dragging the slider bar until the plane is set to the desired level.
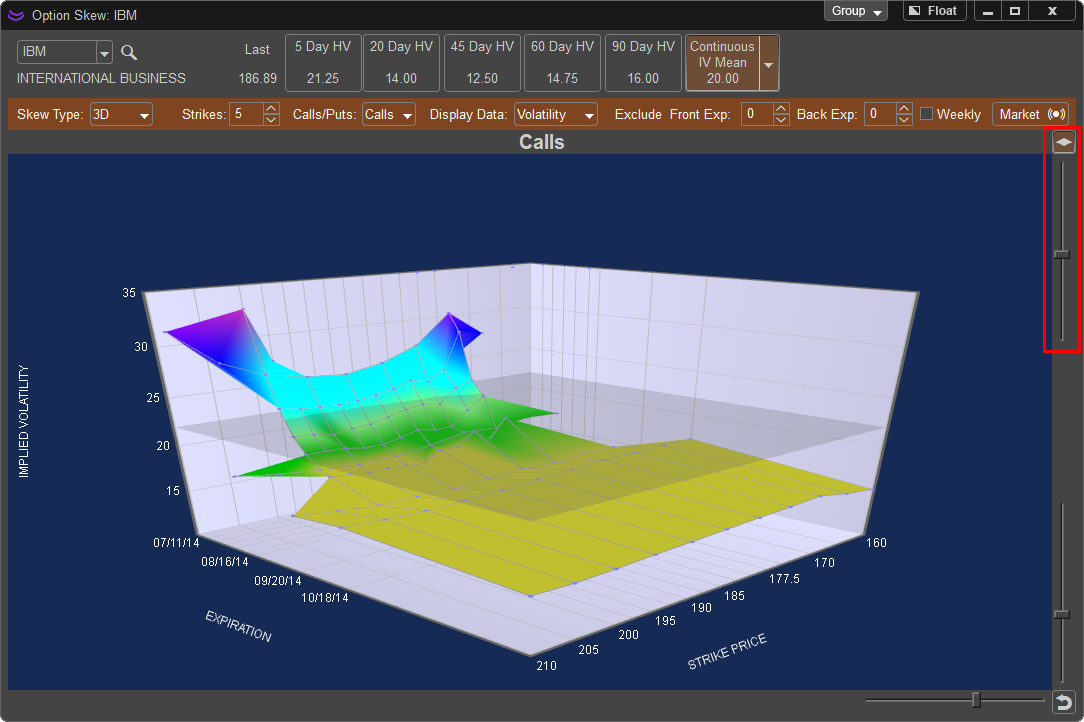
When the Skew Chart Type is set to 3D the following settings are available to modify:
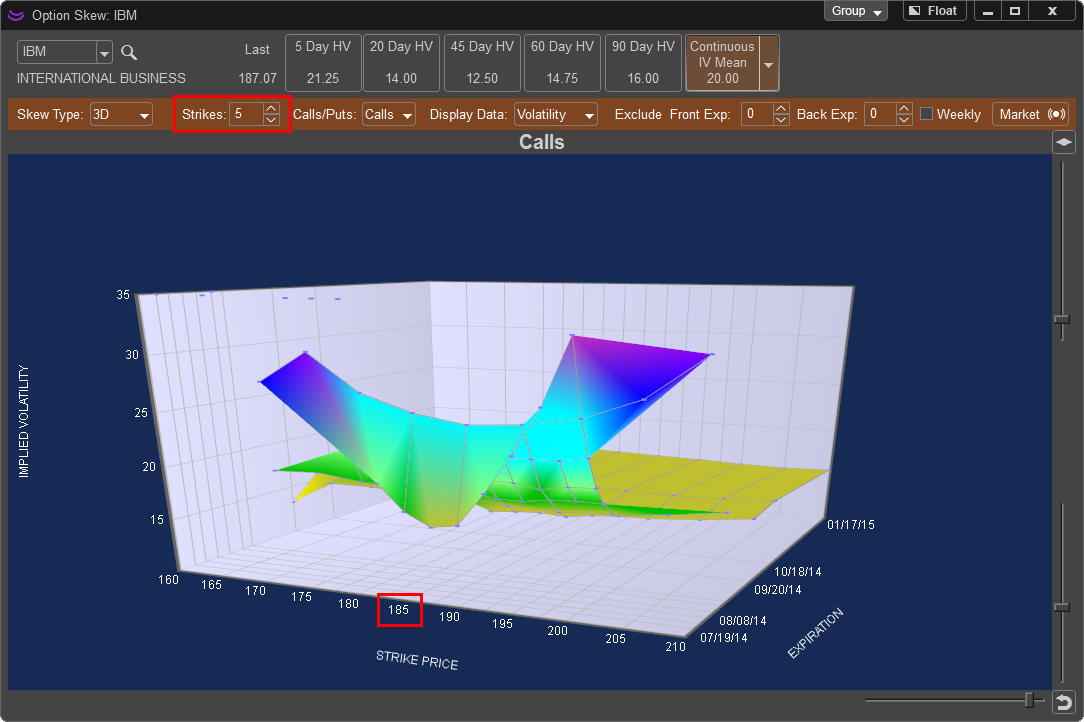
Strikes: Allows the trader to select how many strike prices are displayed on the Skew Chart. If 3 is chosen the Skew Chart will show the nearest to the money Call or Put and three additional contracts in the money and out of the money.
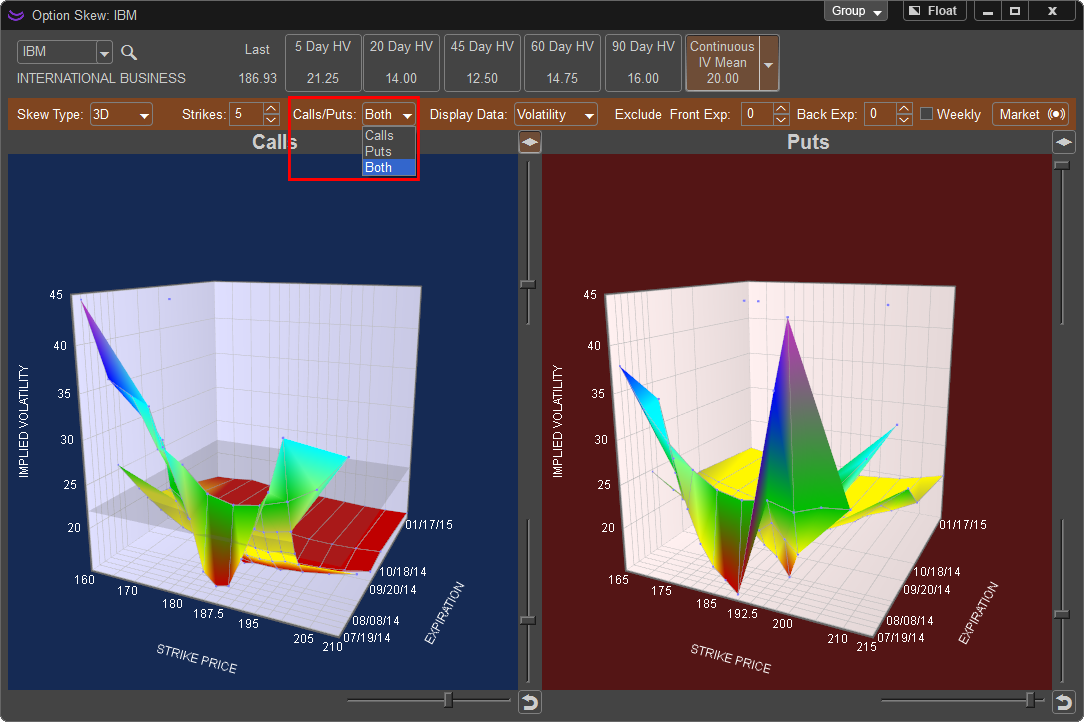
Calls/Puts: Selects which options to show on the Skew Chart. The user can also select both to show Calls and Puts simultaneously on separate 3D Charts. Each chart can be manually adjusted via the slider bars and individual skew planes are available.
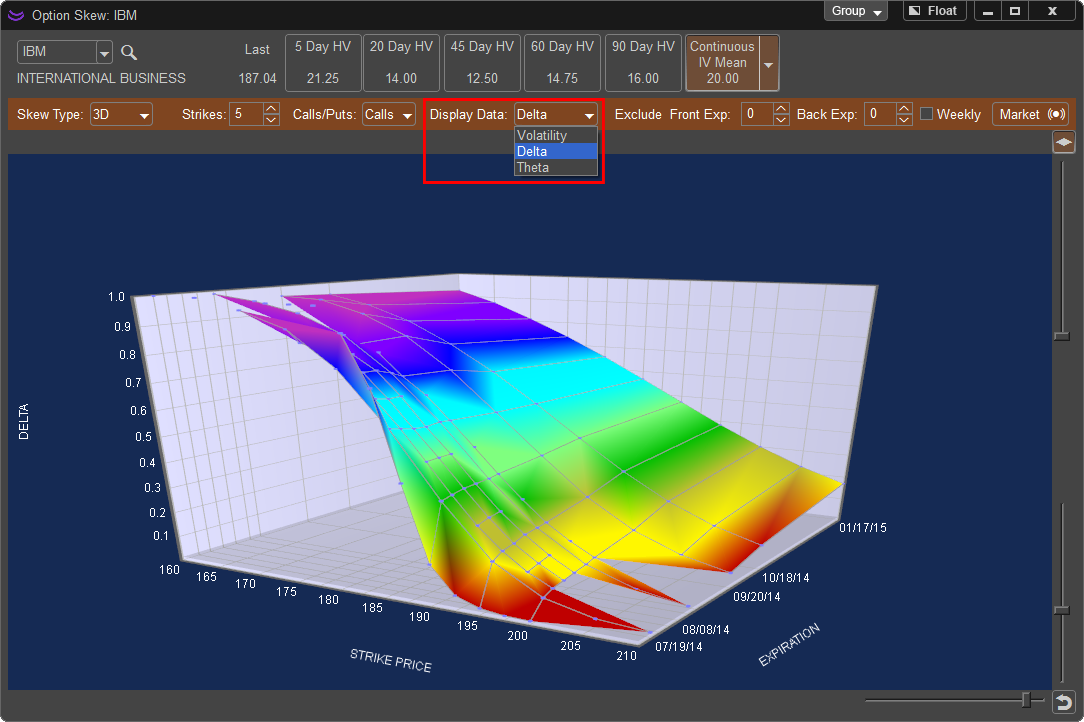
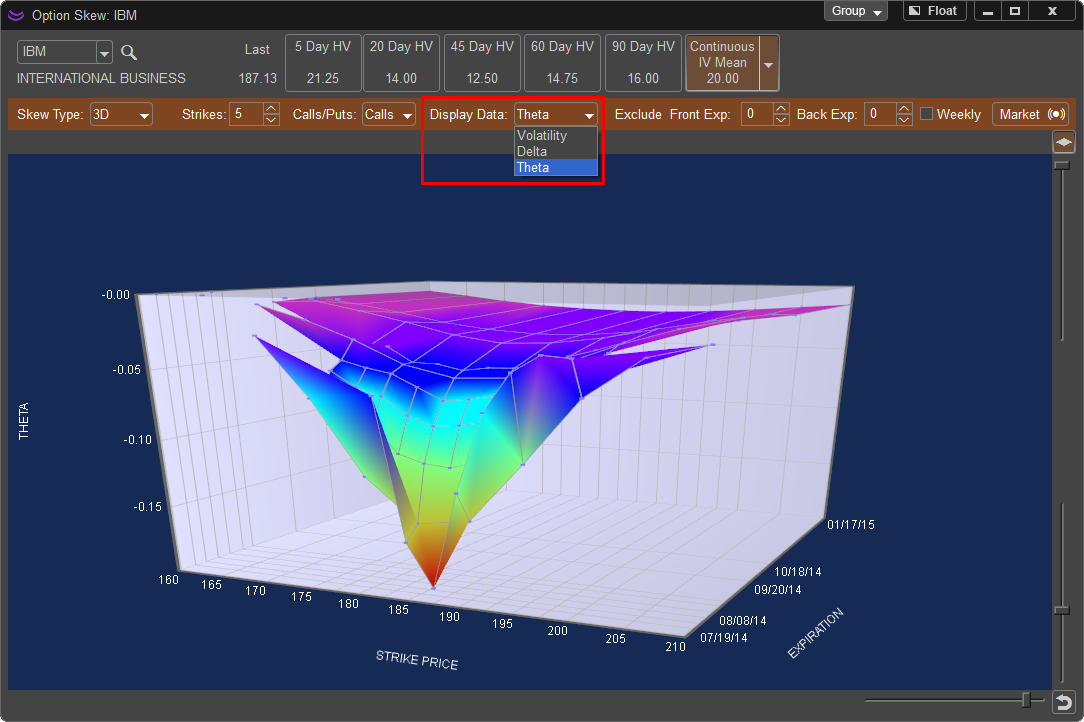
Display Data: The Skew Chart by default is designed to show skews of Volatility but can also be used to show skews of an option contracts Delta or Theta by selecting these from this drop down menu.
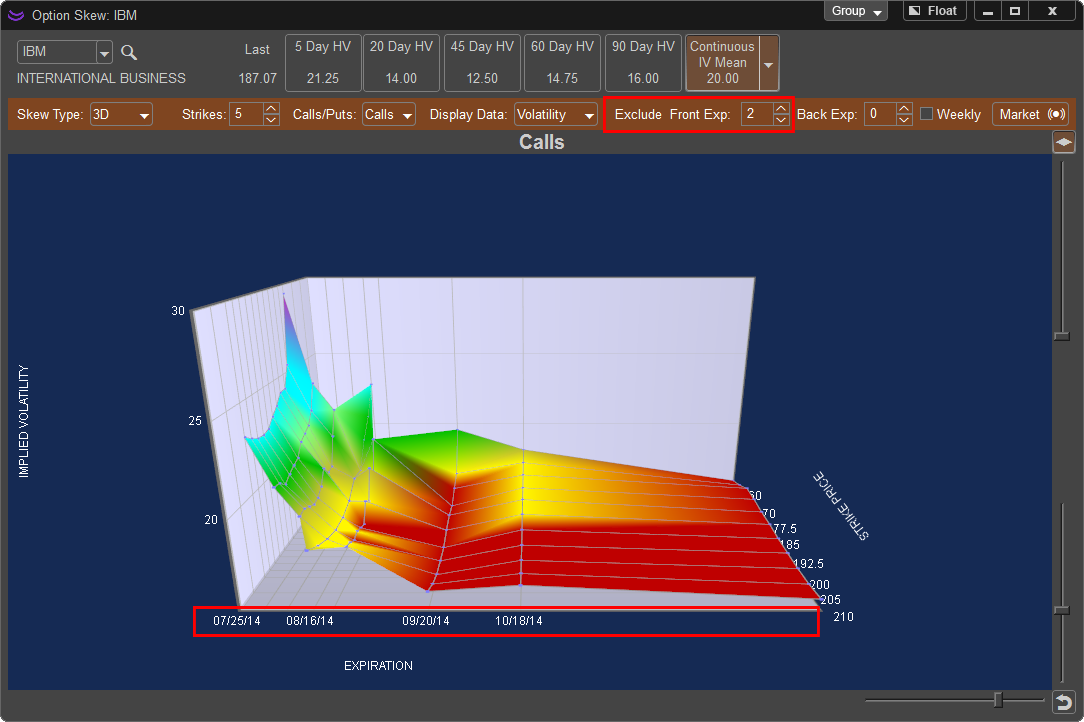
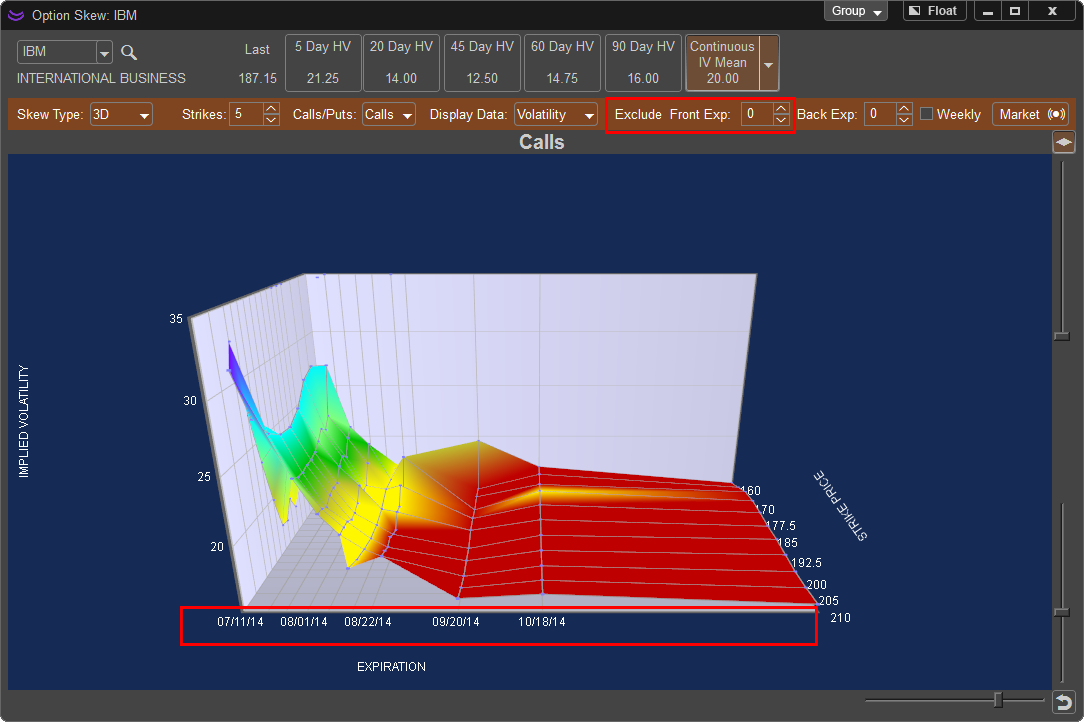
Excluded Expirations: The 3D chart shows all available expirations by default, this option allows you to exclude the closest expiration to the current date. For example, setting this to 2 would exclude the last (farthest out in time) two expirations from being displayed on the 3D Chart.
In the image below Excluded Expirations is set to “0” and will show all expirations. Note that not all expirations have date stamps. For example IBM (shown below) has weekly options and due to the dates being close together the expiration date is not shown. However you will notice the grey grid lines indicating an option contract, totaling 9 separate expiration dates.
Excluded Expirations is now set to “2” removing the last two expiration dates from the skew chart changing the viewable expirations to seven.
